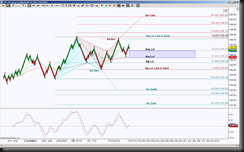
SPY, the ETF for the SPX index, has an intraday chart perspective of harmonic patterns playing out very well. Currently what this does is help price test extremes of a sideways range but these particular patterns have extension targets for traders, once the range no long holds price in its parameters.
 I’m using an STRenko 25 Bar size, this shows the cyan triangles formed a Bullish Gartley harmonic pattern, which had a completion at 195.06. Another pattern, a Bearish Bat shown with the brown triangles completed at 198.10. Now both of these patterns went into retracement mode, the first retraced approximately 88.6%, and the second pattern has currently retraced approximately 61.8%. Being a Fibonacci gal and recognizing harmonic pattern rotations with the naked eye, I see that a new pattern is forming which will have a completion target at an existing Significant Level of 195.72.
One might ask how that is beneficial information. Well, I look at charts as puzzles and the more pieces I see that fit together, the clearer the scenario becomes. There are no money back guarantees in trading, there’s always a risk, and it’s unlikely that two people will trade the same setup exactly the same because it’s very unlikely that those two people have the same emotional strengths or weaknesses, account size, experience, and risk tolerance. All we have is probabilities in trading, so if Fibonacci’s and harmonic patterns offer me higher probabilities, by gosh, I’ll take them.
So, back to the chart, what all these triangles and color coordinated Fibonacci’s tell me is that for an intraday view on SPY, a pull back to 196.94 and hold there, offers me a long opportunity to the ideal target at 200.29 and scaling points at the brown fibs and emphasis at 198.29 because this is a line in the sand level and will eliminate the opposing pattern’s extension targets of 193 and 191.56 if price pushes through 198.29.
Those who know me, know I like to be prepared for multiple scenarios, not being prepared for a different outcome can definitely be costly. So what this chart also tells me is that if price holds (closes and keeps below) 196.94, then I have a short opportunity to 195.72 and there’s at least two reasons why I like that level, a new harmonic pattern completion target and it’s an existing Significant Level, with a scaling point at 196.22. Now, like I said above, this will just help price get lower to increase the probability of testing the bottom of the range of 194.13 to 198.29.
However, each level on my chart that fails to hold as support increases the probability of reaching further down to those targets of 193 and 191.56, and each level that price fails to hold as resistance increases the probabilities of testing the higher levels, the ideal one being 200.29.
So whether you use harmonic patterns and or Fibonacci’s, I strongly urge you to have probabilities in your trading toolbox. (Of course, harmonic patterns and Fibonacci’s help define probabilities)
