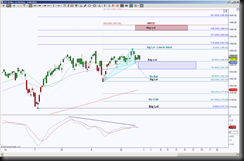
SPY began stalling in a sideways range after breaching a previous high by .72 with negative divergence, this means that momentum is weaker than price, if price follows momentum, the bias is to the downside, and thanks to harmonics, we have key levels to watch for support tests.
So now with a new high, the bulls need some follow through to have upside continuation at this juncture. However if price completes an emerging harmonic pattern, this will help price exceed the immediate range support and increase the probability of testing a previous low of 181.31 and 173.71.
 Pictures are worth a thousand words, this day chart shows that 190.42 is an important level, because if price breaches above it, it will invalidate the emerging harmonic scenario that requires a downside move for its completion. And a hold above 190.42, yes there’s a difference between breach and hold, then the probability increases to test the target 197.30 with key scaling points at 191.78, 194.05 and 195.81.
The immediate range is between 190.42 and 186.94, there is confluence at the support level so it has more bearing if price fails to hold it up there. A hold below 186.94 has the ideal target of 182.35 and scaling point at 184.79. I’m going to note here that I consider scaling points as potential bounce or reversal points as well as the ideal targets. Back to the levels, a completion of the harmonic pattern at 182.35 brings price very close to a previous low and bounce point of 181.31 so this will be another important support test.
Downside continuation has the ideal target of 173.71 with scaling points at 177.83 and 175.68.
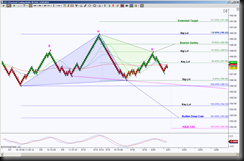
 Now, for a closer view of what is going on in the immediate daily sideways range, I’ve chosen an STRenko 28 bar size for an intraday perspective. This chart shows price is in between opposing emerging patterns, this is typical with consolidation. But what other benefit herein lies, is a completion of one of these opposing emerging patterns on an intraday perspective will help the larger scenarios play out.
As long as price holds below 187.99, this increases the probability of testing the line in the sand level 186.48, then the neckline for the emerging Head & Shoulders. A break down of the neckline has the ideal target at 182.39 with scaling points at 184.33 and 183.28. Do you notice that the ideal target for the Head & Shoulders at 182.39 is very close to the daily harmonic pattern completion target of 182.35?
If price is able to push above 187.99, the initial target is 188.92, above there has the ideal target of 189.58. This target will either be a reversal point, at least for a pull back, or a nice scaling point in route to higher targets. Above 189.58 has the ideal target of 191.49 which will help price push above that daily 190.42 level. It’ll be at this point we’ll see if the bulls can step up to the plate for the onward and upward target of 197.30.
