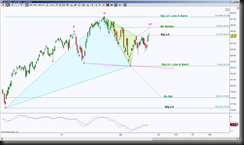
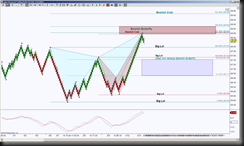
The NASDAQ ETF, symbol QQQ, closed Tuesday with an indecision day bar at an important level, a double bearish PRZ from an intraday perspective and a Significant Level on a day chart, according to a harmonic pattern formation. This is a decision point and I’ll walk through the scenarios in harmonic pattern terms on both the bigger picture and intraday view.
 The day chart shows a doji day close right at the significant level 88.27, I like to draw triangles for a simple visual of three important levels shown by the three points of the triangle. The green triangle’s midpoint is right at the 88.27 fib line so above it implies an attempt to either complete the harmonic pattern at 89.63 or test the top of the triangle point at 91.36. A hold below the triangle point implies an attempt to test the lower point of the triangle at 83.28.
There are opposing harmonic patterns, meaning one pattern needs to go to the upside to complete and the other needs to go to the downside to complete, notice how two points of both of the triangles correlate at the same level,namely 91.36 and 83.28, this gives more importance of whether these levels hold as resistance and support.
There’s also an emerging Head & Shoulders formation, a hold below 88.27 implies the right shoulder is in place, otherwise, a test and rejection of the 89.63 PRZ implies that is the right shoulder, either way, if the right shoulder is complete, that neckline has confluence with that double triangle point of 83.28. This adds more importance of that level.
 To fine tune what is going on with that doji day bar, I’ve used an STRenko 20 Bar for an intraday perspective. This chart shows a reason for the stall is because price is testing a double bearish pattern PRZ, this means there are two separate harmonic patterns that merge into one zone to complete.
The initial stall here implies a pull back attempt to test 87.97, what happens with that scenario is key, because if it bounces there or fails to get there, this type of price action suggests another attempt of that red PRZ and possibly a test of all levels inside the zone, or even a push through the zone to test the extended target of 89.48. This scenario helps price hold above the triangle point on the daily chart.
However the longer price holds below the bottom of the zone, the higher the probability of testing 87.97, and a break down there increases the likelihood of going into retracement mode. Keep in mind, the hold below the zone can be after pushing inside the zone to test all the levels or failure to push inside the zone, the point being that 88.57 is an important level to hold as resistance. This scenario keeps price below the daily triangle point with the anticipation of retracing those bearish patterns and the ideal minimum target of 85.53, but a stronger retracement pushes price below 85.53 and increases the probability of testing the daily Head & Shoulders neckline.
That confluence area of 83.28 has the capability of keeping price in a sideways range or offering the opportunity to retest previous lows.
