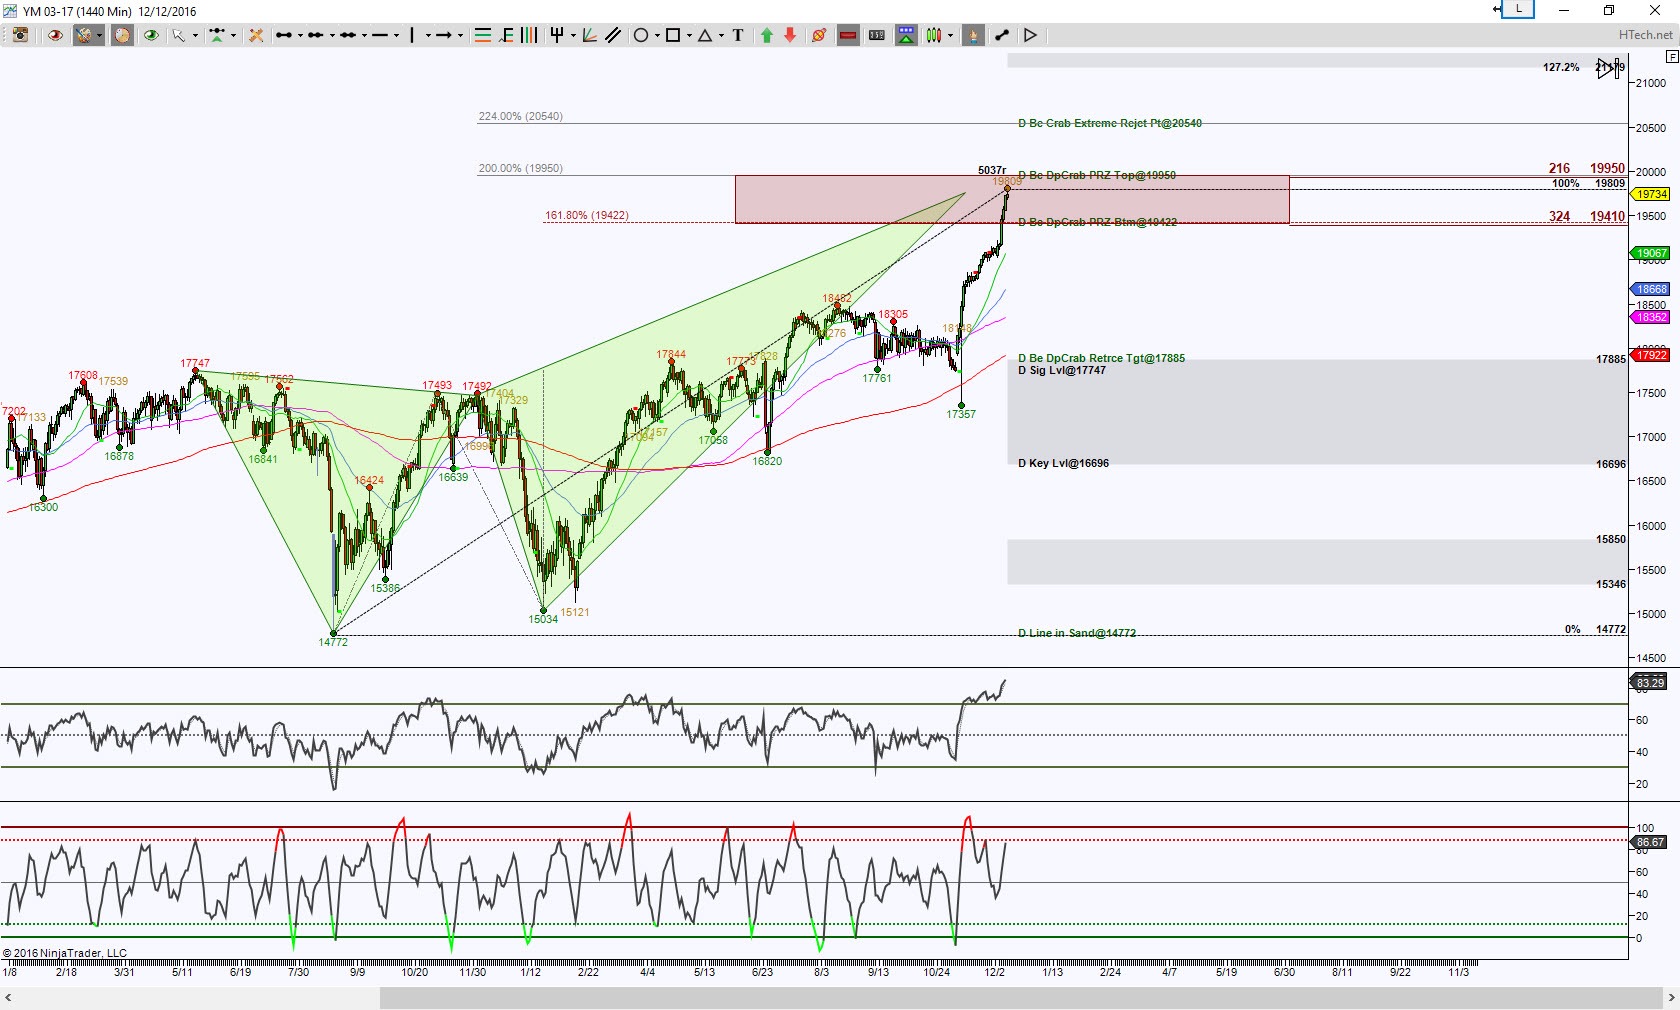
Emini-Dow futures Day chart shows price inside a completion zone (PRZ) for a bearish harmonic pattern, called a Deep Crab. Where price can break and hold beyond this PRZ offers initial directional targets to be sought. Ideally I’d like to see price test all levels of the PRZ before anticipating a Reversal Mode aka a pull back to retrace the pattern, however a hold below the PRZ prior to testing the top of the zone will get my attention especially with conviction.
So a hold below 19410 does increase the probability of Retrace Mode. having an ideal minimum target at 17885 and scaling points or potential obstacle to that scenario at 19215. But momo is still pulling price upward, so the current probability scenario is to test the top of PRZ and that will be a very important resistance test. Again, where price can break and hold outside of the PRZ is key. An upside break has the extreme target for this particular pattern at 20540, above there risks elimination of this pattern.
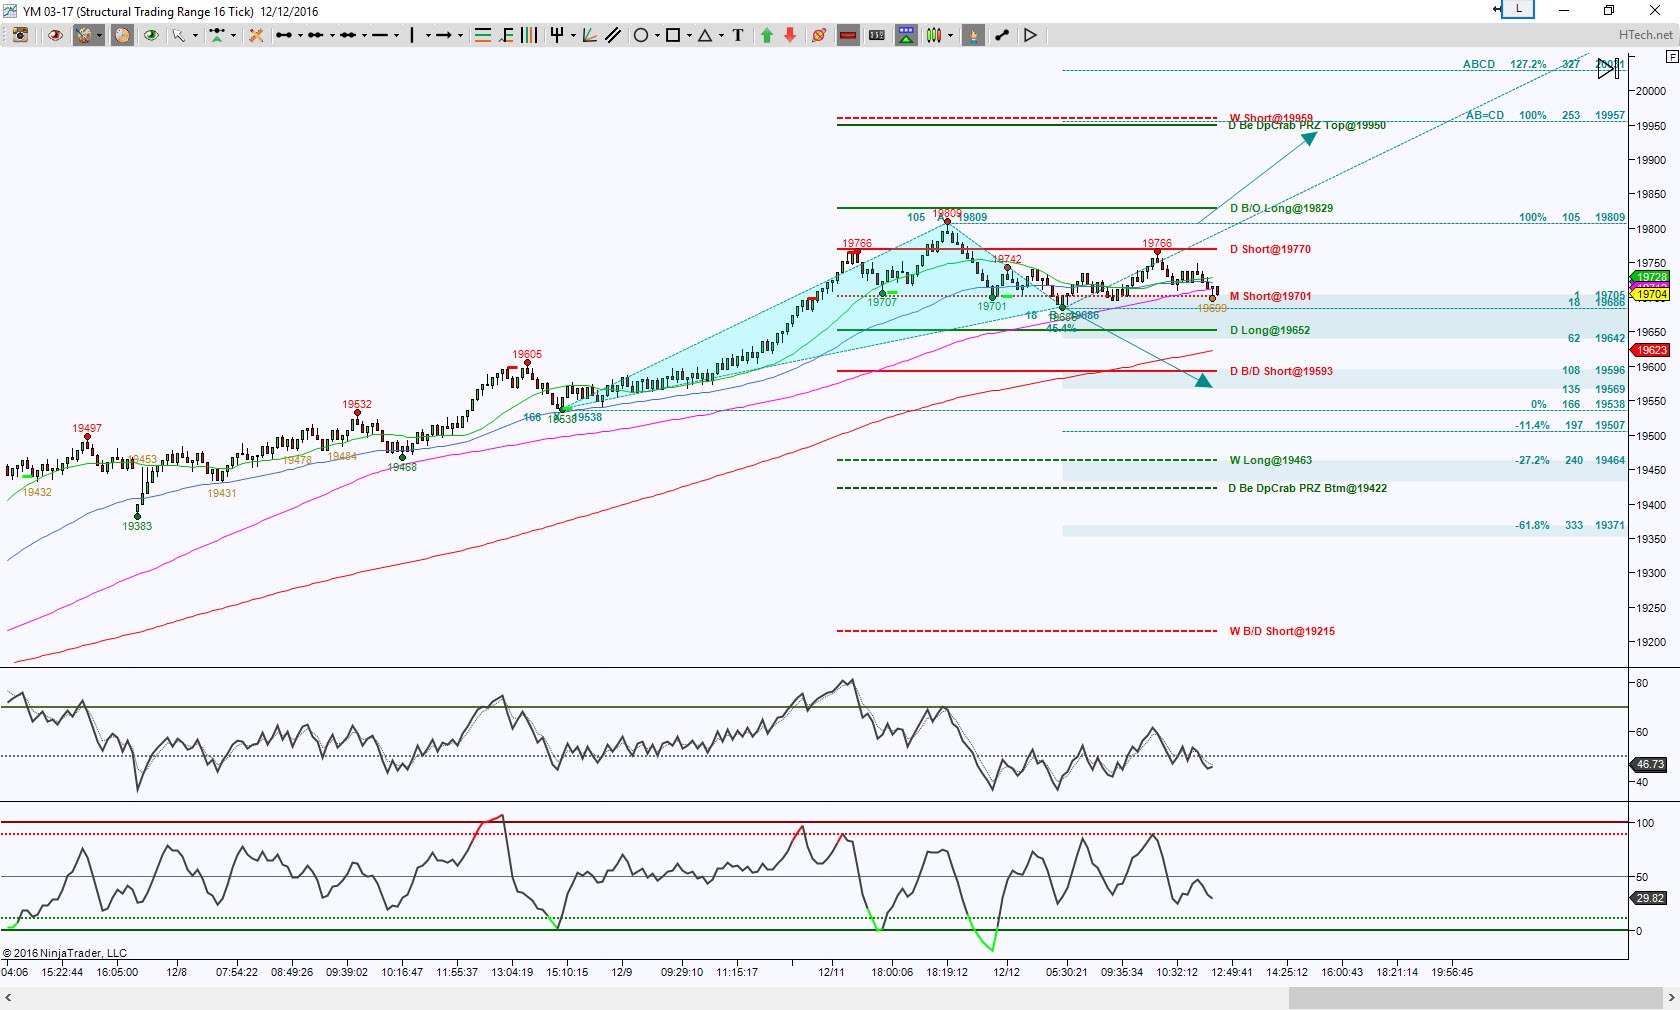
For a zoomed in view of what’s happening inside the PRZ, I’m looking at an intraday perspective using an STRange 16 bar chart. This chart does include what we call Swordlines and when they correlate with harmonic targets they deserve respect.
So this chart shows a stall effect and the initial levels to break and hold are above 19770 then more important above 19809 or below 19686. There is currently a downside pull and rollover attempt but that 19686 is the level to watch initially, below there will increase the probability of completing the emerging cyan colored Bat at 19569. This will be an important support region because below there will have an extended harmonic pattern target at both 19507 but more important 19371, note this particular target will help price test the bottom of the Day chart PRZ.
Price is in a range and that 19686 is key level to hold or not, so if momo pushes upward and price holds above 19686, the the probability is to test top of range. If price can take out 19809 then it invalidates the cyan Bat and focuses on completing the cyan ABCD at 19957. This scenario helps price test the top of the Day PRZ.
Trading involves substantial risk and is not suitable for all investors. Past performance is not indicative of future results.


