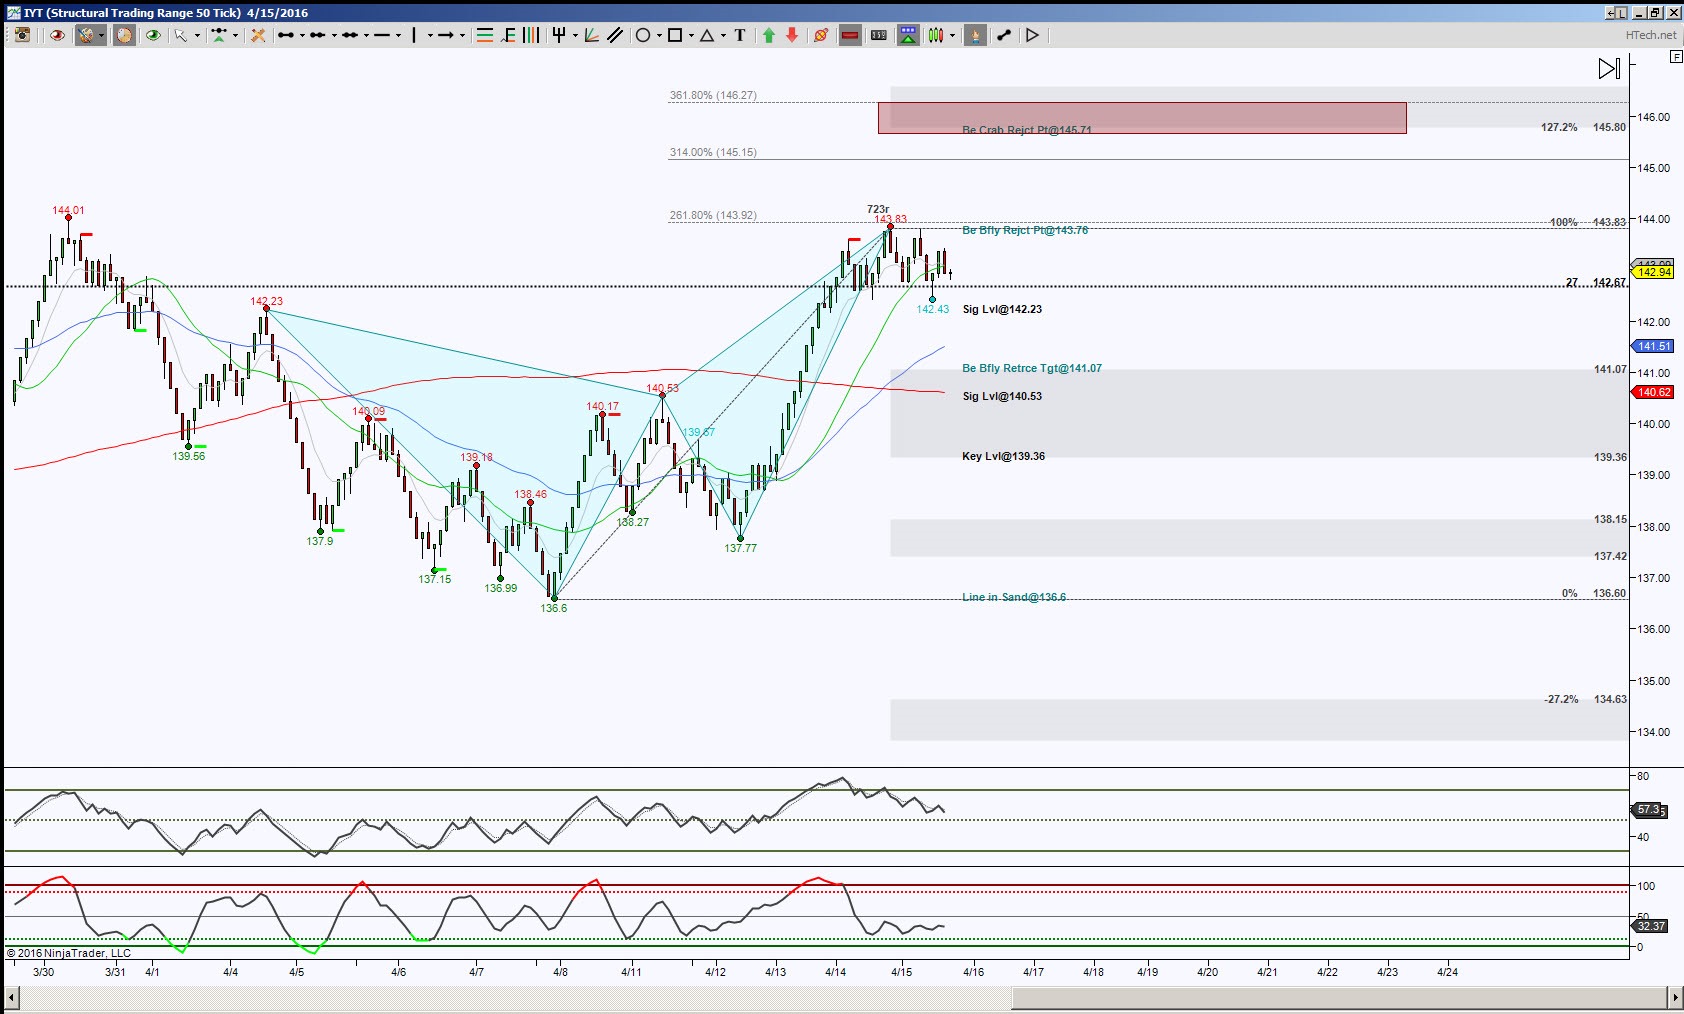
IYT, the ETF for Transportation has stalled after completing a harmonic pattern, a Bearish Butterfly. I’m looking at an intraday perspective and in this case, using an STRange 50 bar chart.
The Butterfly completed at 143.76 then jammed up in sideways consolidation. The initial levels to break and hold are above 143.92 or below 142.67.
An upside break and hold above 143.92 has upside continuation ideal target at 145.71, this scenario says thank you to the Butterfly to be a stopping point in route to higher destination.
A downside break and hold below 142.67 increases the probability of Retrace Mode of the Butterfly and has initial key support test at 142.23, then ideal minimum retrace target at 141.07 and ideal target at 136.6 and scaling points at the gray levels. That 141.07 test could breach to tag 140.53, but as long as price can hold above 141.07 suggests a retest of the Butterfly or another attempt to complete the Crab at 145.71. But once price is inside the gray zone called a Golden Ratio Zone (141.07 to 139.36), the key is where does price break out of the zone for increased probability of noted targets in that direction.
Trading involves substantial risk and is not suitable for all investors. Past performance is not indicative of future results.

