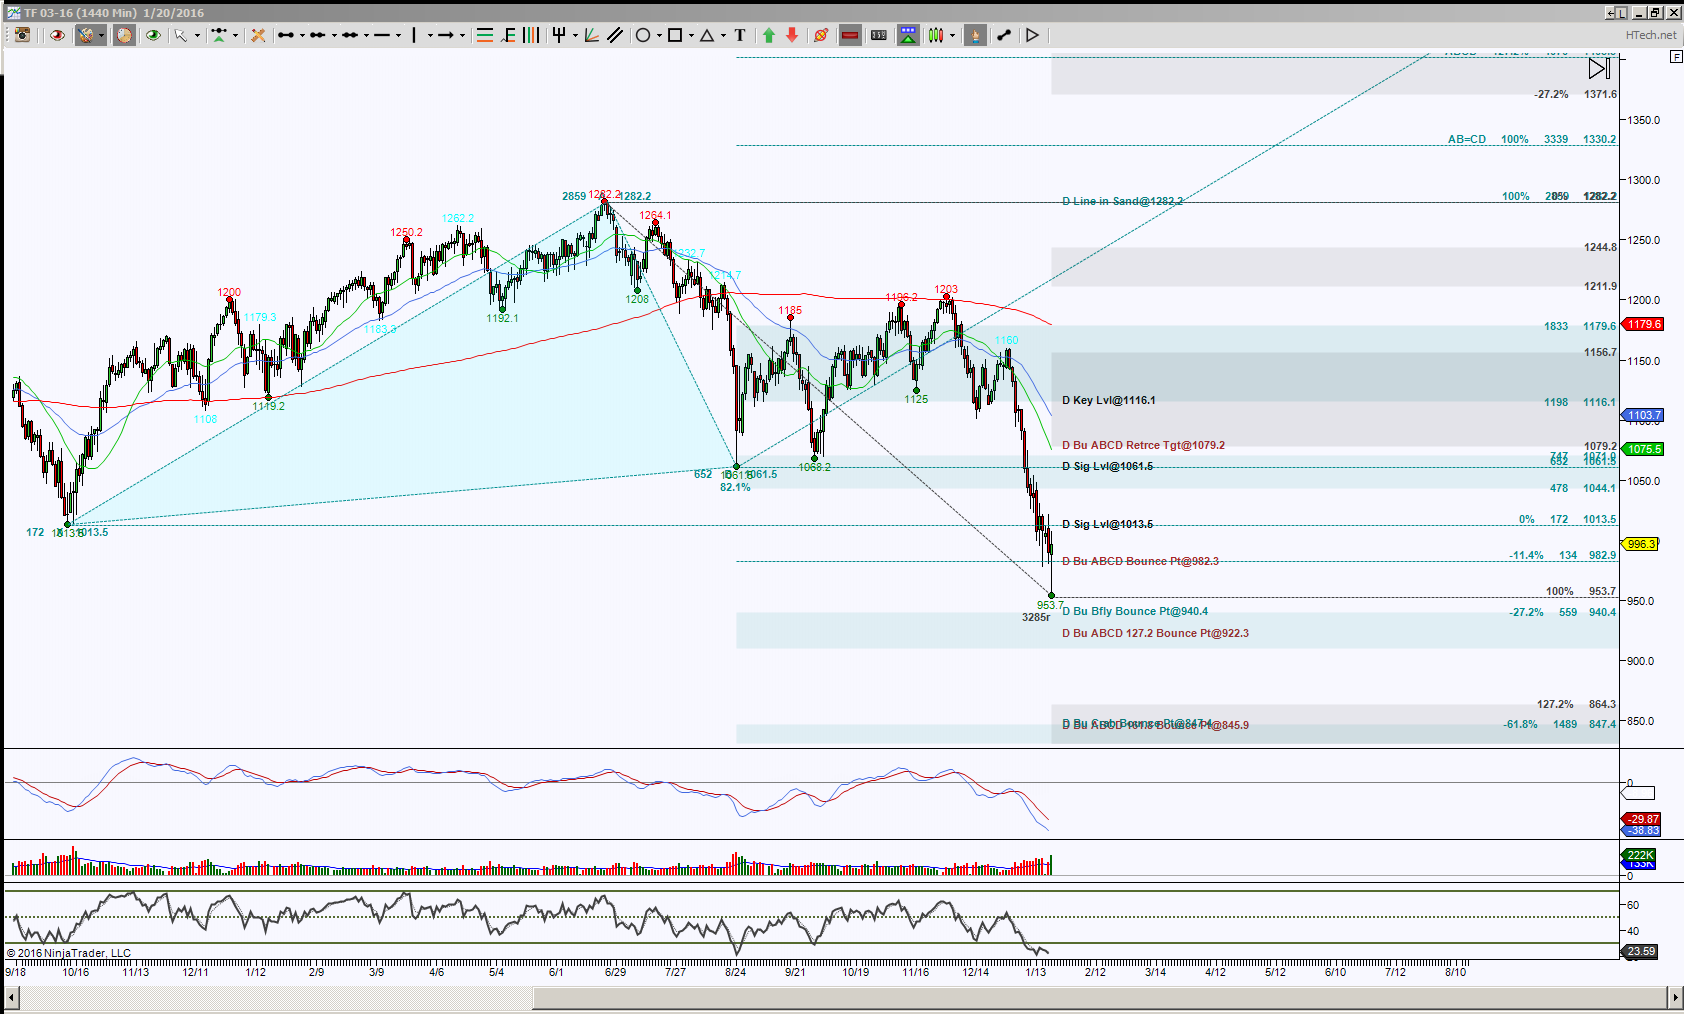
The Russell 2000 Emini futures, symbol TFH16, shows that price has gone to the dogs. Let me clarify, I’m a dog lover and anything my dogs receive is not a sign of inferiority, I just couldn’t resist the metaphor.
The Day chart shows that price has fallen with conviction as it took out what I call Significant Levels at 1061.5 and 1013.5. There’s multiple observations being offered on this chart and one of the first key components is that price is very extended and this typically is followed by a stall or bounce into nearby resistance levels. Since the hold below 1116.1, I was looking for a primary downside target of 940.4 to 922.3 as well as 847 but scaling points along the way at 1061.5, 1013.5 and 982.3. I do consider “scaling points” as potential rejection levels and currently price breached below the 982.3 target yet closed back above it.
So the levels of 1013.5 and 982.9 are the current stall levels and once price can hold beyond one of them offers directional targets. An upside break of 1013.5 has the initial target of 1061.5, this will be a very important resistance test for me, because above it risks shifting the bias from down to up and if up is the scenario, I’ll look for the gray colored targets up to 1282.2, then I’ll reevaluate the situation.
A downside break of 982.3 has an ideal target of 847.4 but due to a double PRZ (aka two different harmonic patterns that merge into a Potential Reversal Zone), this will be a very important support test area and has the potential of preventing price from getting to my ideal target of 847.4.
These particular Harmonic pattern completions offer the bulls an avenue to get on, but will need more horse power than the bears to bulldoze through the resistance barriers.
Trading involves substantial risk and is not suitable for all investors. Past performance is not indicative of future results.

