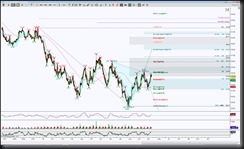
I like to look at the oil futures for overall view regarding oil stocks. An hour chart of April contract shows price is in a pull back mode to test some convergence support at 33 region. This will be a key level to hold or not to keep an intraday upside bias. In the world of harmonics, ideally I’m looking for upside targets of 37.97 and 40.59 but there are obstacles in route, the initial being 34.21.
Looking at my hour chart, the cyan colored triangle represents the initial phase of an emerging pattern and where price is in relation to the triangle’s midpoint at 34.21 is key, if price can hold above it, it increases the probability of testing 37.97, if holds below it implies an attempt to retest the lower triangle point with a key support test at 31.25, then 29.44 to 29.04 zone.
Trading involves substantial risk and is not suitable for all investors. Past performance is not indicative of future results.

