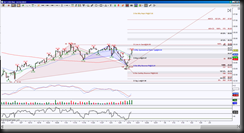
XLF, the banking sector ETF, is in a retracement mode of a Bullish Butterfly and approaching a symmetrical target at 24.54. Due to expansion of price, there’s a probable stall or snap back to the initial support test at 24.27 but the bigger picture important levels for price to break and hold are either above 24.99 or below initially 23.87 then more important 23.24.
I absolutely love it when smaller harmonic patterns help larger ones play out. In this case a blue colored Butterfly helped the brown colored emerging Gartley form its B point, which I like to refer to as the triangle midpoint. Then the retracement of the blue Butterfly is either forming the third out of four legs for that brown Gartley OR, providing price can take out the 24.99 with conviction, forming the final leg of an ABCD pattern with an upside target of 26.25.
Back in September of this year, I was looking at a much larger harmonic pattern for an upside completion target at 27.55 (another Butterfly … another interesting facet in harmonic rotations, the patterns often will repeat themselves in an instrument), so those brown ABCD targets will help that much larger gold Butterfly play out. Ha! Harmonic patterns working together in Harmony!
The other side of the coin, and even though all things can be pointing to one scenario, there’s no guarantees so I like to be prepared for the “what if, then what” perspective. So IF that line in the sand level of 24.99 or IF that symmetrical retracement target of 24.54 evolves into a region where sellers appreciate that opportunity to step in and begin to take out the initial support targets, THEN it’ll be very important if price can hold below 23.87 or not, this risks shifting the bias from neutral with upside pull to downside pull and I’ll be looking for that 22.62 target.
Trading involves substantial risk and is not suitable for all investors. Past performance is not indicative of future results.

