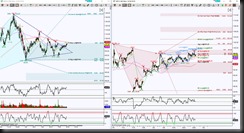
NFLX broke out of a Day chart’s triangle formation but could be reeling back because price is approaching a GRZ level of 99.65 (Golden Ratio Zone aka the area between 38.2% and 61.8% fibs) as well as a 200 MA. And due to expansion there’s a probable stall or pullback into support.
The left chart is the Day chart and the cyan zone is a GRZ, and the rules for GRZ’s state that where price can break and hold beyond it offers a probability of directional bias.
The right chart shows an Hour chart that has a zoomed in view of what’s happening in this region. Interesting that the initial level to hold above or below is 97.74. Above it has two harmonic patterns emerging, the larger one colored brown is what I drew using my STZones drawing tool and that ideal PRZ (Potential Reversal Zone aka completion of a pattern) target at 105.83 but there’s also a smaller blue pattern that was auto-drawn by HPCollection indicator and its PRZ target of 99.7 correlates with the top of the brown zone at 99.36 as well as a Weekly Swordline so this will call price to it providing price can hold above that 97.74 level.
But below that 97.74, where price currently is, has an initial pull back target of 96.4, another Weekly Swordline, but there’s a downside calling to 94.86 and this will be a region for the Bulls to defend, failure to do so implies a return inside that Day chart triangle.
Trading involves substantial risk and is not suitable for all investors. Past performance is not indicative of future results.

