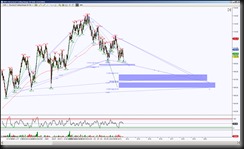
The ETF for RUT (Russell 2000) is IWM. For an intraday perspective, I’m using a proprietary STRange 50 bar chart. The HT Harmonic Collection indicator generated three emerging harmonic patterns.
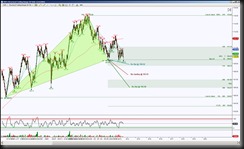
Using proprietary drawing tool, STZones, I’ve isolated the largest Bat but keeping the smaller pattern PRZ’s noted.
All three of the patterns has what I call a Significant Level to contend with before pattern completion can be fulfilled. This Significant Level represents the triangle mid point for all three patterns, if price holds above it, it keeps price inside the green Golden Ratio Zone (aka the area between 38.2% and 61.8% fib ratios) and if price can hold above the GRZ then the implication is an attempt to retest the high triangle point at 115.05.
But the intraday bias is to the downside as long as price can hold below 111.14 then more important below Significant Level 109.51. The initial PRZ target is 108.92, note this will help price test the green GRZ bottom of 108.72, this will be the initial area for bulls to defend. Failure to do so has the ideal target of 105.98, ideal because this is the largest of these three patterns and another scaling point aka the second area for bulls to defend at the brown Gartley at 107.61.
Trading involves substantial risk and is not suitable for all investors. Past performance is not indicative of future results.


