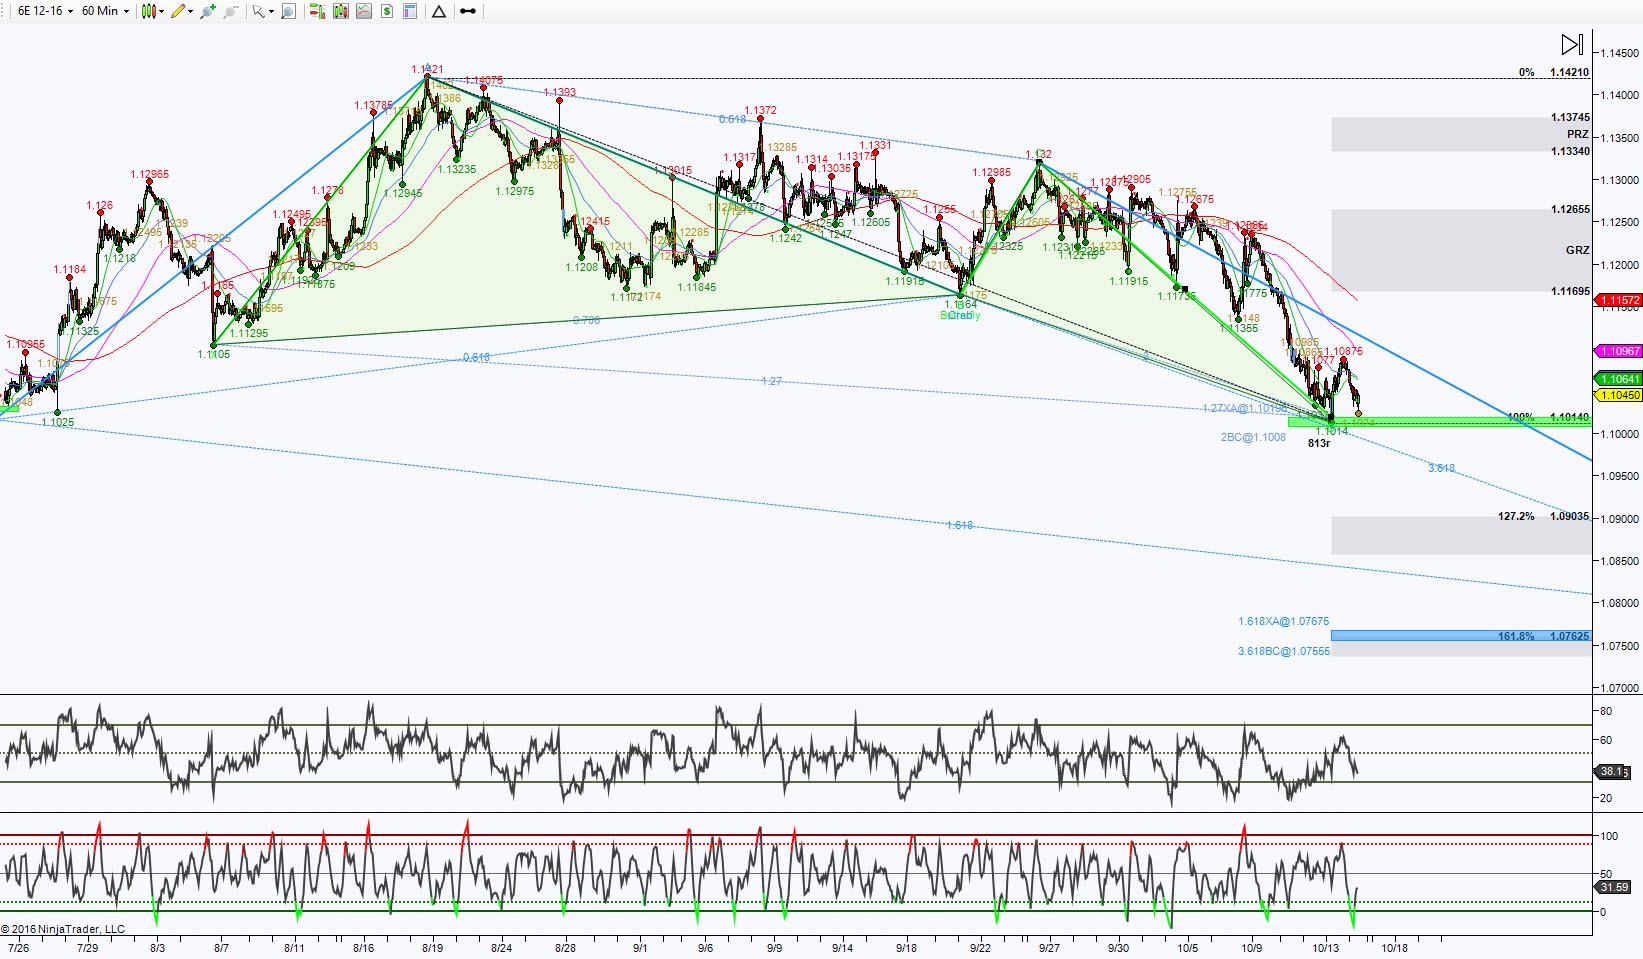
6EZ16, has lost its footing in multiple harmonic pattern completions which offered opportunities for an upside Retrace Mode. Currently the hour chart shows price is stalling at a pattern called a Bullish Butterfly at the PRZ (Potential Reversal Zone aka the zone where a harmonic pattern completes) at 1.10195 to 1.1008. The initial test had a snap back jump but that was an embarrassing retracement in the world of harmonics and the bias for this chart so far holding toward the downside.
The green zone at 1.10195 to 1.1008 is the initial area to hold or not. A hold above the PRZ has an ideal minimum retrace target of 1.11695 and a rejection or failure to get there occurs, the downside pull is the stronger scenario. There is a larger pattern with much lower target at 1.07675, this is calling price to it with a break down of 1.1008.
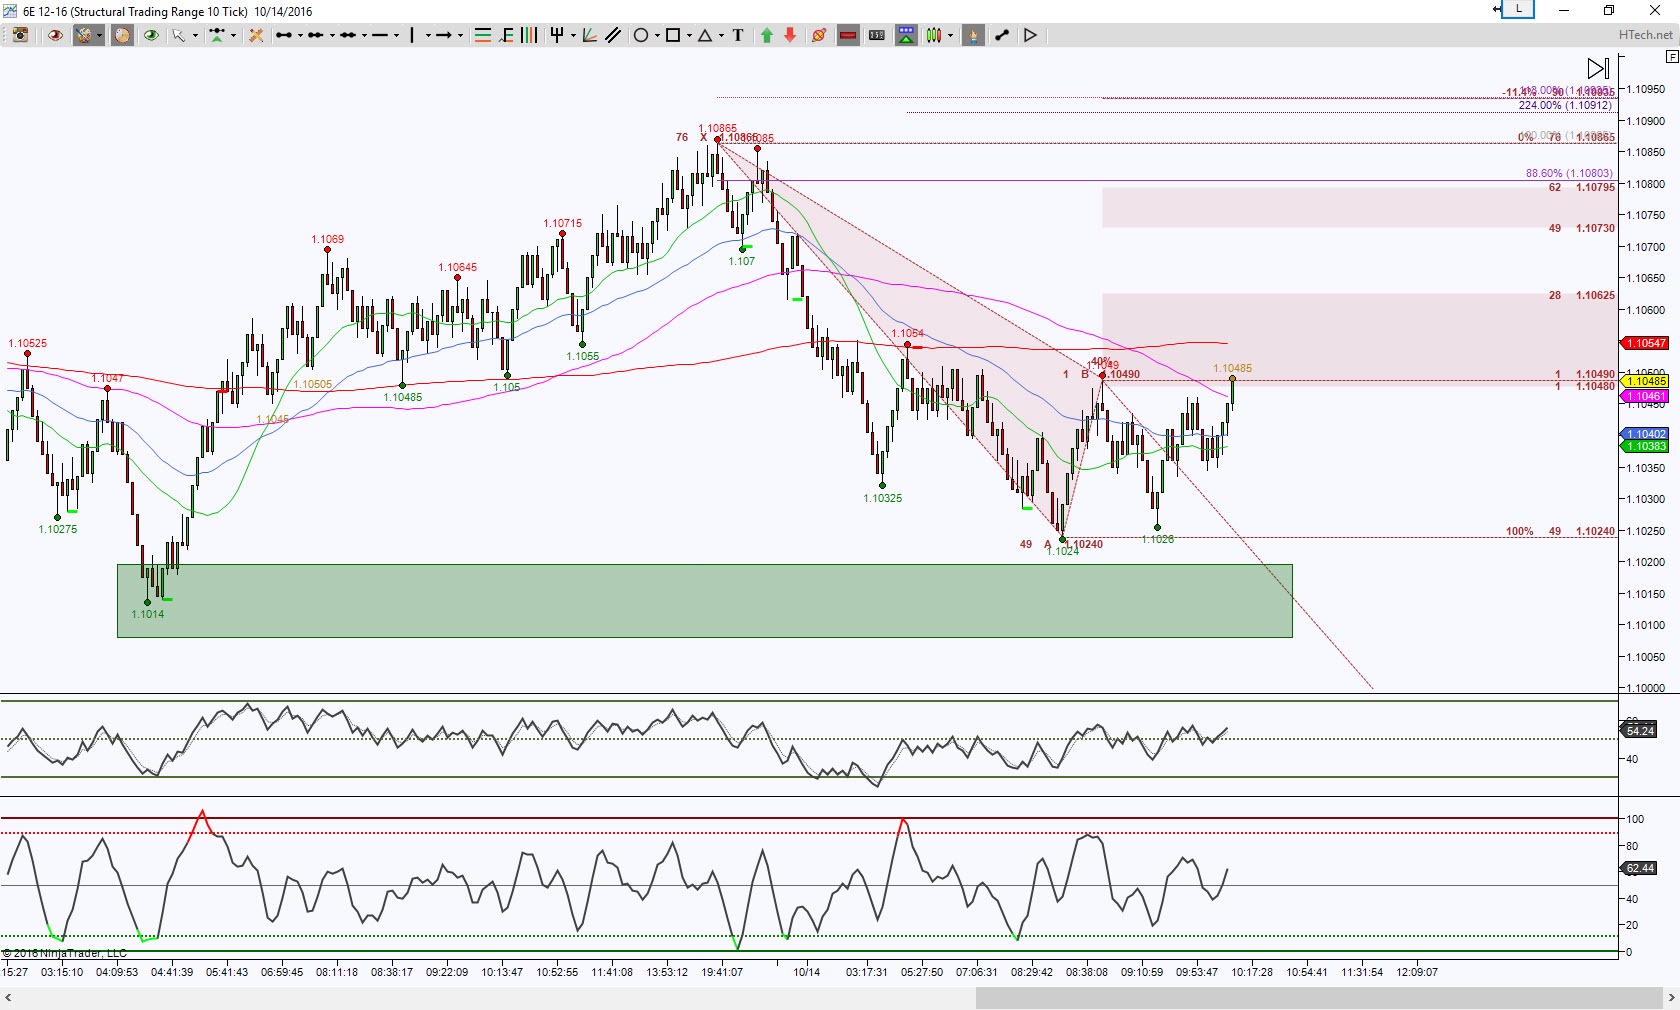
For a zoomed in view at this current PRZ, I’m looking at an STRange 10 bar chart.
This chart shows that the 1.10490 is the initial key levek to hold above or below. If can hold above it has an initial target of 1.10625 but harmonic targets at 1.10795 and 1.10912. But a hold below 1.10490 implies a test of all the levels in that PRZ derived from the Hour chart.
Trading involves substantial risk and is not suitable for all investors. Past performance is not indicative of future results.


