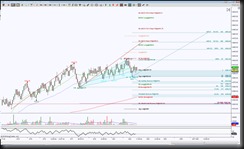
The intraday perspective for the May contract of $NQ_F, in this case I’m using an STRange 50 bar, shows that price is in between opposing emerging patterns with the important do or die levels at either 4421.25 or 4359.75. That is quite a range for day trading, but there are initial levels as well which will help one of those extremes play out if there’s follow through.
Price is stalling on top of a GRZ, the region I call Golden Ratio Zone between the 38.2% and 61.8% Fibonacci ratios. So 4397.75 is the initial support test to hold above or below. Above it implies another attempt to hold above 4412.75, if so, then more important above 4424, there’s a large brown colored ABCD target at 4463.5, which does have convergence with a smaller cyan colored ABCD 127.2% target so that behaves like a magnet as well as a probable obstacle once there.
Since price is in a neutral bias, price could just as well hold below 4397.75, if so there’s a significant level 4383.75 for a support test, this is a two fold support region, it’s the bottom of the GRZ as well as the B point for an emerging Gartley, so to take it out (hold below it) has the 4373 target with a potential breach to 4366.75. This will be another decisive region because it is one of two things, it is an opportunity for buyers to step in to go into Retrace Mode for the Gartley or it is merely a means to an end for lower targets. There is a double PRZ (two harmonic patterns merging into one zone) at 4324.75, this is calling price to it and increases in probability with each noted support level that cannot hold.
Trading involves substantial risk and is not suitable for all investors. Past performance is not indicative of future results.

