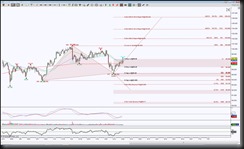
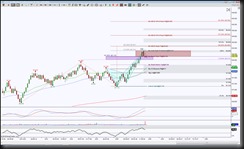
US Dollar futures has an intraday double PRZ (Potential Reversal Zone aka harmonic pattern completion zone) which includes a Shark and a Crab. When there’s a double harmonic pattern convergence, it offers not only a major magnet for price to get there, it also has a strong probability of being a rejection zone. One of the cool things (yeah, I grew up in the 70’s and 80’s) is that the Day chart has an emerging pattern that I’m watching for clues if it has completed its third of four legs. So let me break it down.
First let’s look at the Day chart, there’s an emerging Butterfly which entails four legs, the third is the current segment and looking at it with Friday’s large Day candle, the initial thought is it’s not quite convincing that the third leg has finished its run. I look at other variables outside of candle bars, and until momentum can hold above its midpoint accompanied with higher than average buying volume, I pretty much squint my eye (not good for crow’s feet) and peer upon the price action as suspect. This is not to say that price will not be able to hold above 98.080 key level and that everything won’t validate Friday’s surge because it very well may do just that, but when I see suspicious price action, that trading behavior called patience is calling. So for me, I want to see if price can hold above or below that 98.080 first. And for the record, price could still go higher yet keep the emerging pattern intact.
I also like to look at smaller timeframe or bar size to see what else is happening at a larger timeframe’s important level. So in this case, I’m looking at an STRange 30 tick chart.
Now this intraday perspective shows that there are two different harmonic patterns that have completed, the level conjoining the two patterns is 98.118 and this is the initial level to hold above or below. If price can hold below the Shark PRZ support 98.014, this would increase the probability of an attempt to go into retracement mode with the ideal minimum target at 97.84 and the ideal targets at 97.7 and 97.115.
If the retrace mode occurs, this will bring price back under that 98.08 key level on the Day chart. And if the harmonic dreamed of retrace target of 100% is made at 97.115, this will help price test the bottom of the Day GRZ (Golden Ratio Zone aka the area between the 38.2% and 61.8% Fibonacci levels) at 96.480.
Whenever price is in a PRZ (or GRZ for that matter), it implies price is in decisive mode, so until there’s a convincing break of that zone, anything can still happen, so with that in mind, I want to be prepared for the scenario that if price holds above the intraday level of 98.118, the probability of testing the top of the PRZ is good and there’s a potential breach to testing another pattern, a Bearish ABCD which correlates with the Crab’s 361.8% BC leg. If that’s confusing, just understand that there’s a reason that price could test 98.465 to 98.481 and it will be important what happens at that juncture because it offers sellers an opportunity to step in and if they can’t do that and buyers have the say, then the extended ABCD levels are the next upside targets and that Day chart’s third leg is still forming.
In a nutshell, price is extended on the intraday chart which implies a stall or pull back into support, so those 97.84 and 97.7 targets will be very important support tests and as long as they hold, it keeps the current intraday upside bias, and it’s not until price can break down from there does the probability increase for the Day chart action to test the bottom of it’s GRZ.
Trading involves substantial risk and is not suitable for all investors. Past performance is not indicative of future results.


