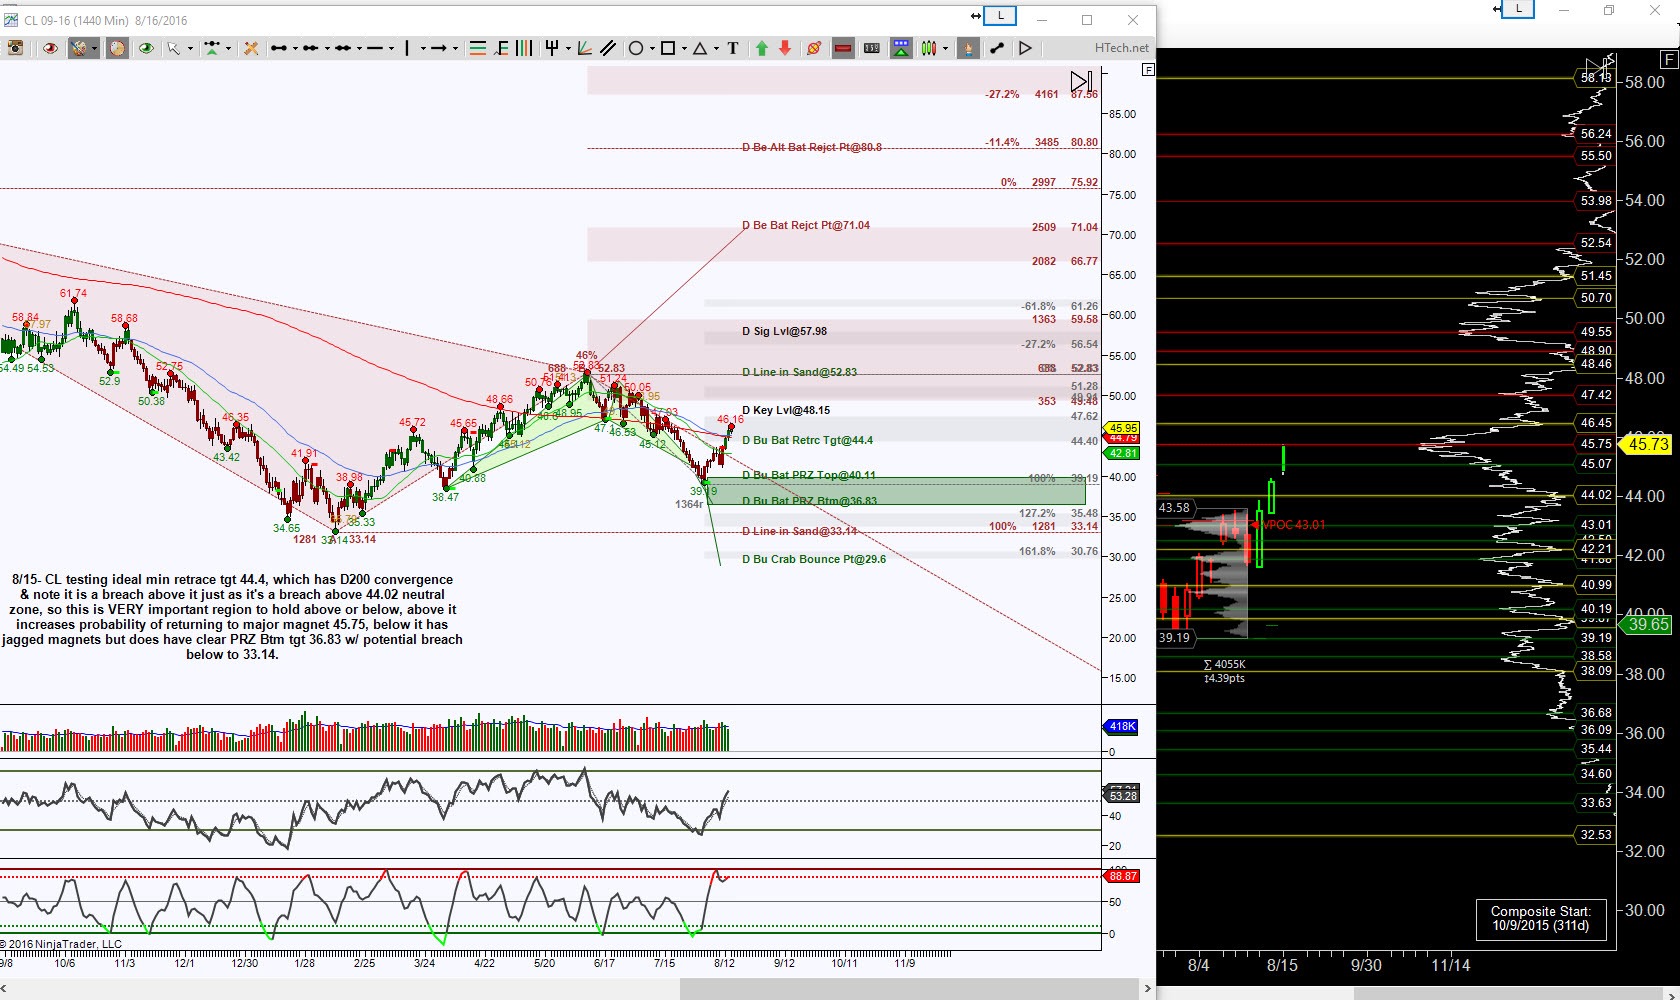
Oil futures composite chart shows price has removed itself from a range between 43.58 to 39.19 while day chart shows price is in Retrace Mode of a bullish pattern as shown in green. There’s some notations on the chart that reflect what I was looking for coming into this week, and one of them was a magnet at 45.75 where Monday’s action sought.
This brings price back to another range between 46.45 and 44.02, as shown with Volume Profile chart as yellow zones, so these being initial levels to break and hold to move beyond the major magnet of 45.75. The thing about magnets is not only does it draw price to it, it is also a place to hold price. Think about it, strong magnets with take some oomph to pull apart.
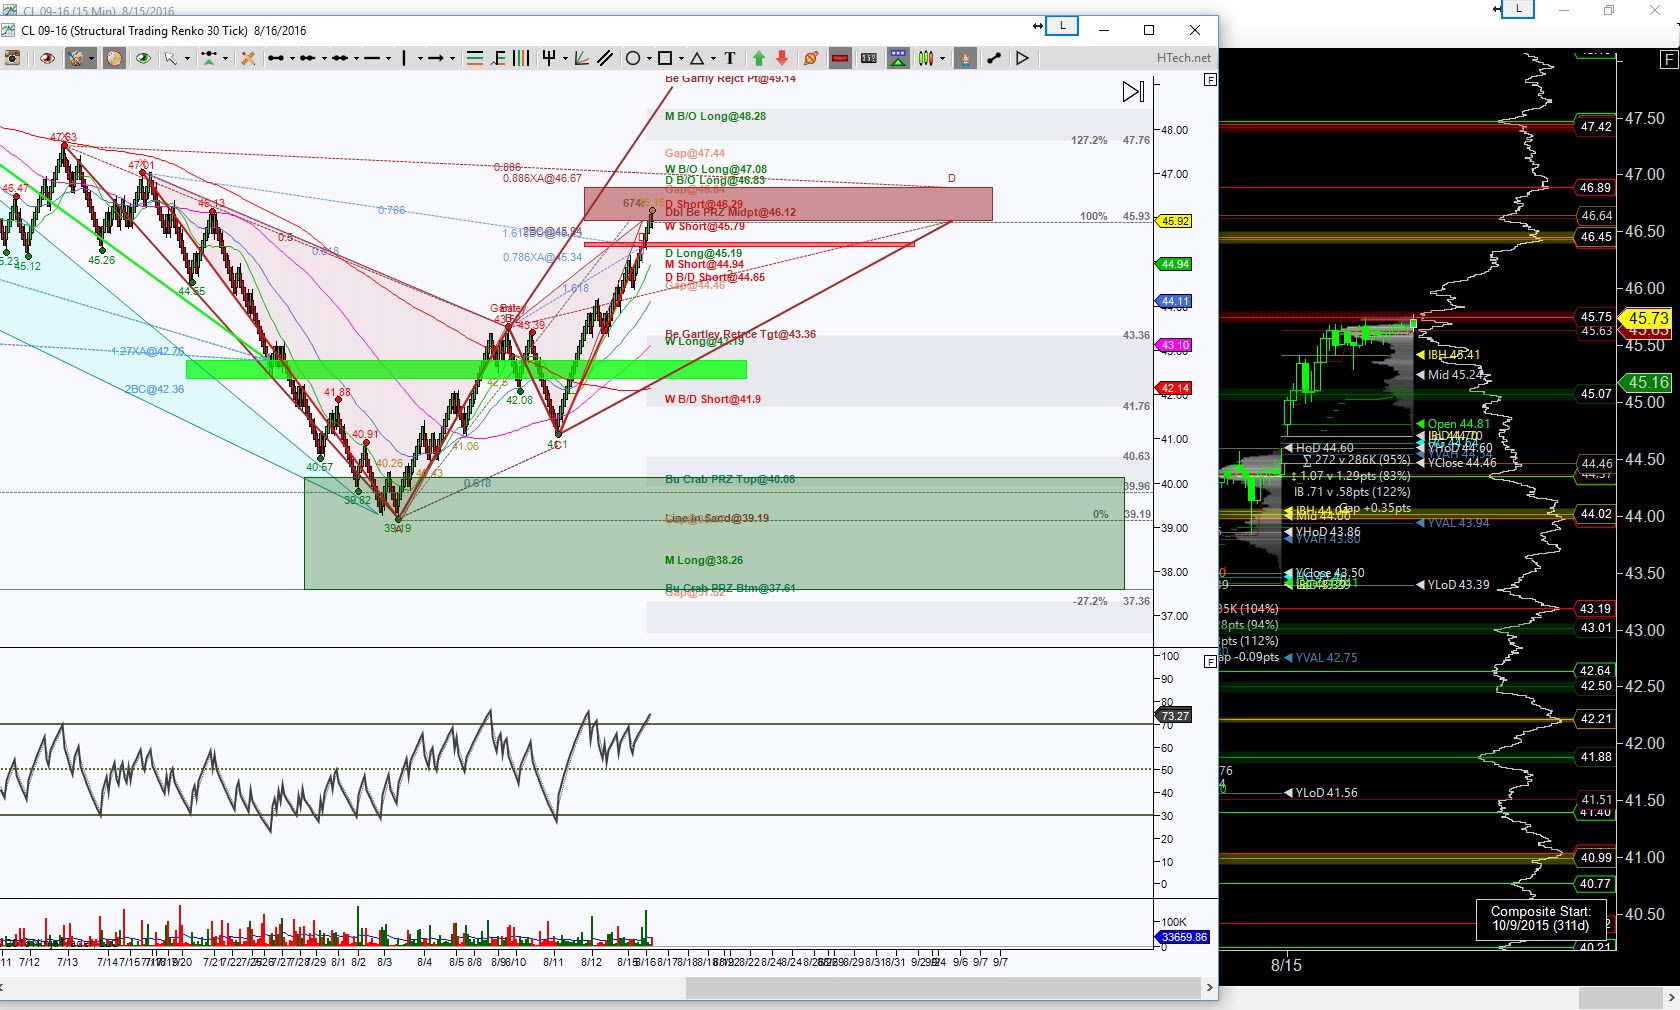
This intraday chart, in this case I’m using STRenko 30 bars may look like a train wreck with lines, but there is structure with the seeming madness. To put it simply, the green zone represents a region that offered a bounce point in the world of Harmonics, this particular pattern is called a Bullish Crab and once price held above the green zone, it increased the probability of going into an upside move for its Retrace Mode.
There’s two other harmonic patterns shown on this chart, they are brown colored, one a Gartley and one a Bat. Their completion targets create what is called a Double PRZ (Potential Reversal Zone) between 45.34 and 46.67. Yes this is a large zone for intraday trading but what’s interesting is the midpoint of these two patterns’ PRZ correlates with the major magnet aka Composite High Volume Node at 45.75. Once price is inside the double PRZ, where it can break and hold (just like the neutral zones in yellow on profile chart) becomes key.
So above 46.67 has an upside target of 49.14. A hold below 46.12 then more important below 45.34 has initial pull back target at 43.52 to 43.19, below there increases probability of returning to that green PRZ.
Trading involves substantial risk and is not suitable for all investors. Past performance is not indicative of future results.


