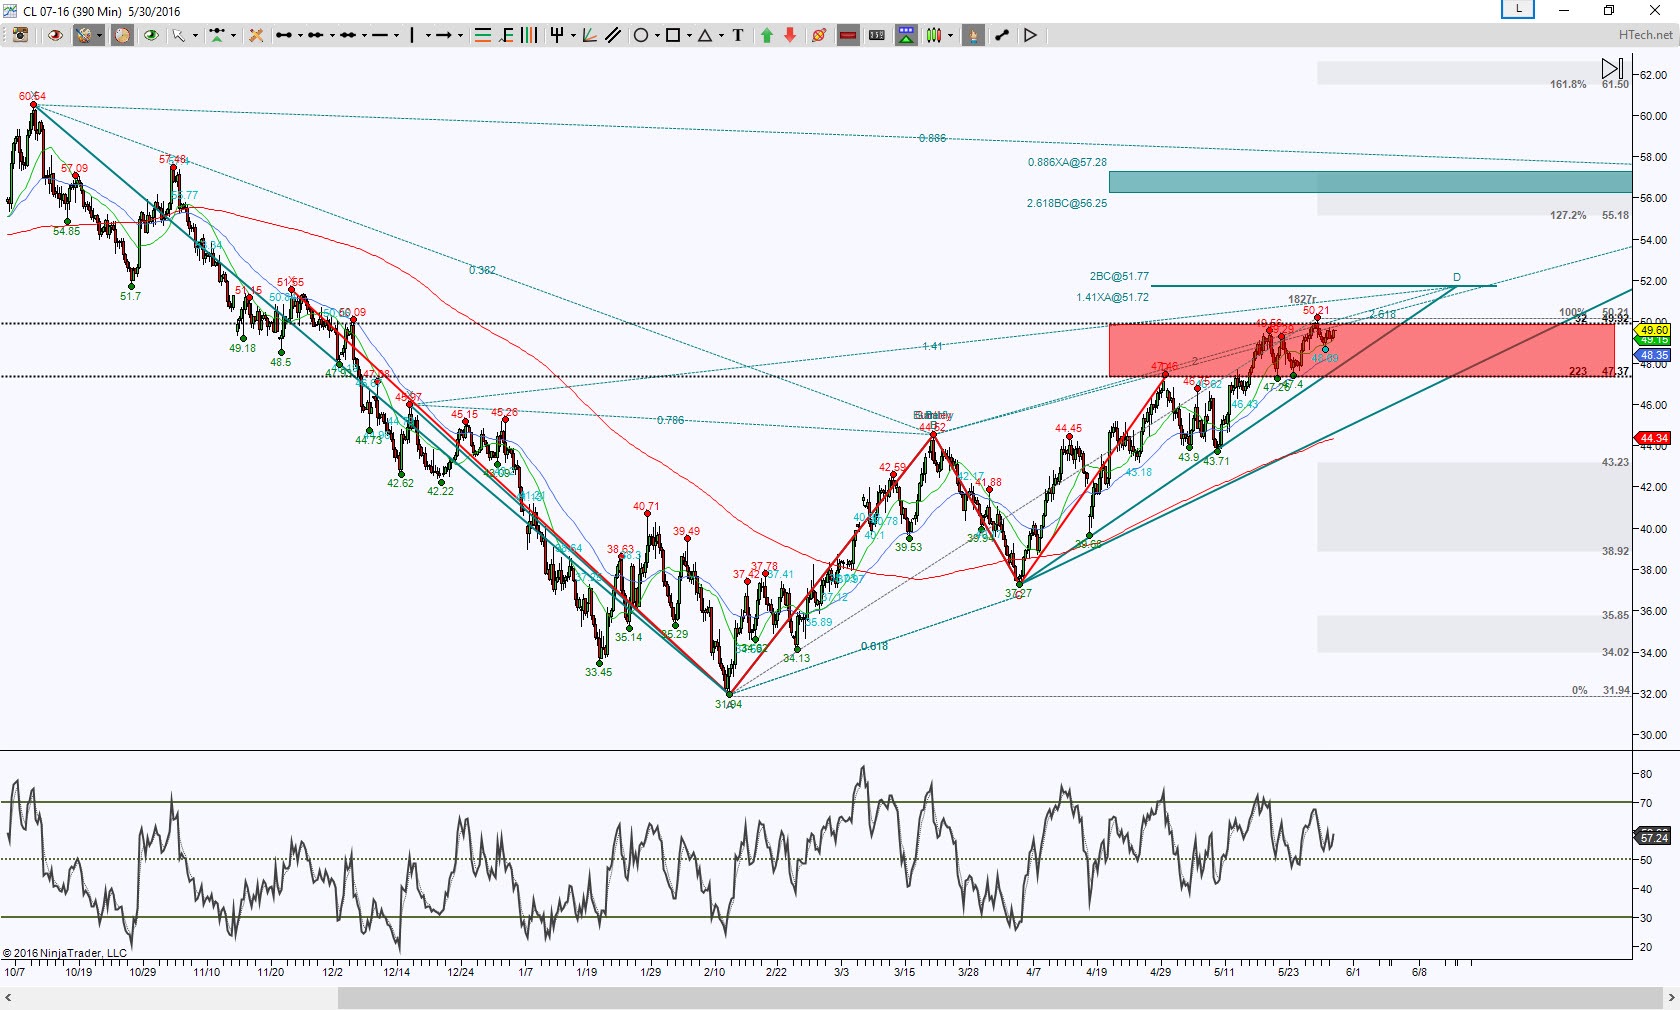
CL_F Day chart has been fueled up to a harmonic PRZ (Potential Reversal Zone aka completion target for a Harmonic Pattern). Currently price is inside a PRZ, where price can break and hold outside of this PRZ offers directional target probabilities.
There’s a potential breach of 49.92 to complete a nearby pattern at 51.72 to 51.77 which is an area for Bears to defend. But a hold above 49.92, then more important above 51.77 has a larger pattern’s PRZ target of 56.25 to 57.28, the latter being the ideal level. Harmonic PRZ targets behave both as a magnet and probable rejection region, dependent on price action of course.
This chart does show an upside bias but like I said, needs to break above this PRZ to increase the probability of testing higher targets. As long as price cannot take out the top of the PRZ, the probability is to initially attempt to retest the bottom of the PRZ and once price can break and hold below 47.37, then the probability increases to go into Retrace Mode, having the ideal minimum target at 43.23 and ideal target of 31.94 and scaling points at the gray levels.
Trading involves substantial risk and is not suitable for all investors. Past performance is not indicative of future results.

