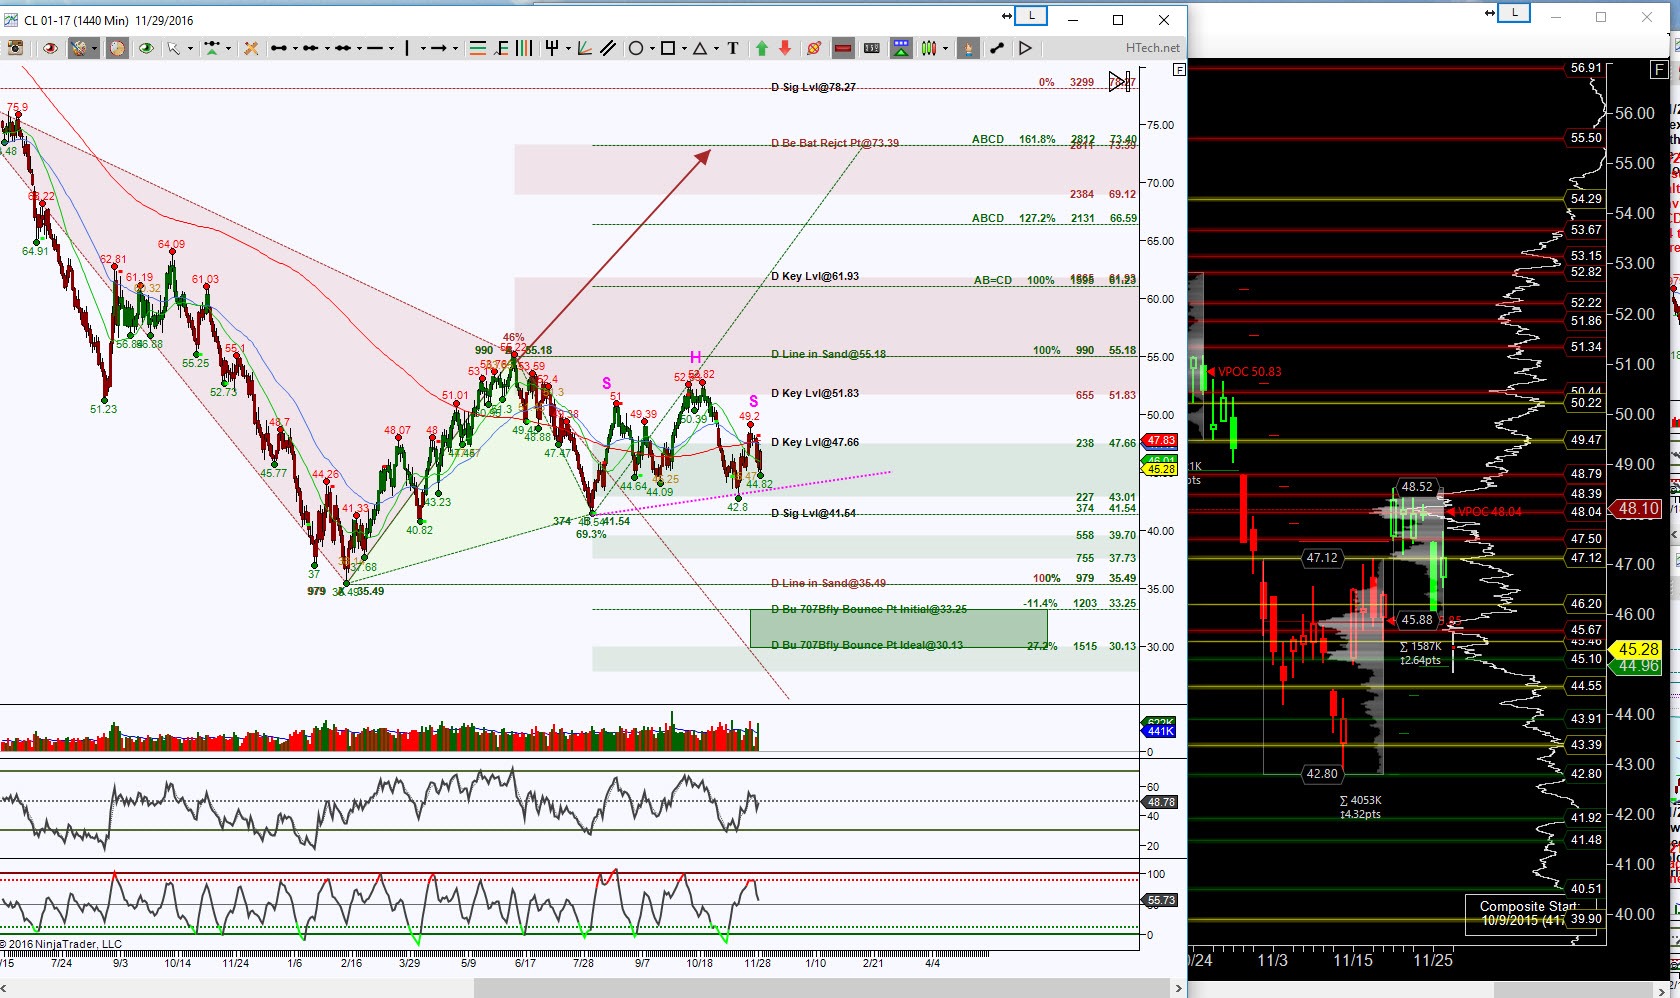
CL_F Day chart shows the overall picture is price is in between opposing emerging harmonic patterns, this is indicative when price is in a consolidation of sorts. The initial levels to break and hold are the GRZ levels (Golden Ratio Zone aka the area between 38.2% and 61.8% Fibonacci’s) so either above 47.66 or below 43.01 but more important below 41.54, to increase the probability of directional targets to be sought.
There’s are major magnets at 48.1 and 45.67 so this tells me that there needs to be conviction to hold outside of the green GRZ levels, by conviction I mean for momentum and bar color to correlate. At this juncture, there is a slight downside pull and that bias increases below 41.54. There’s a Head & Shoulders pattern, it’s 100% target with a breakdown of the pink dotted neckline correlates with the green colored Butterfly PRZ as shown with the green zone. Be prepared for a break in either direction since when price is inside a GRZ it represents a decisive period and the decision is based off a hold beyond its parameters.
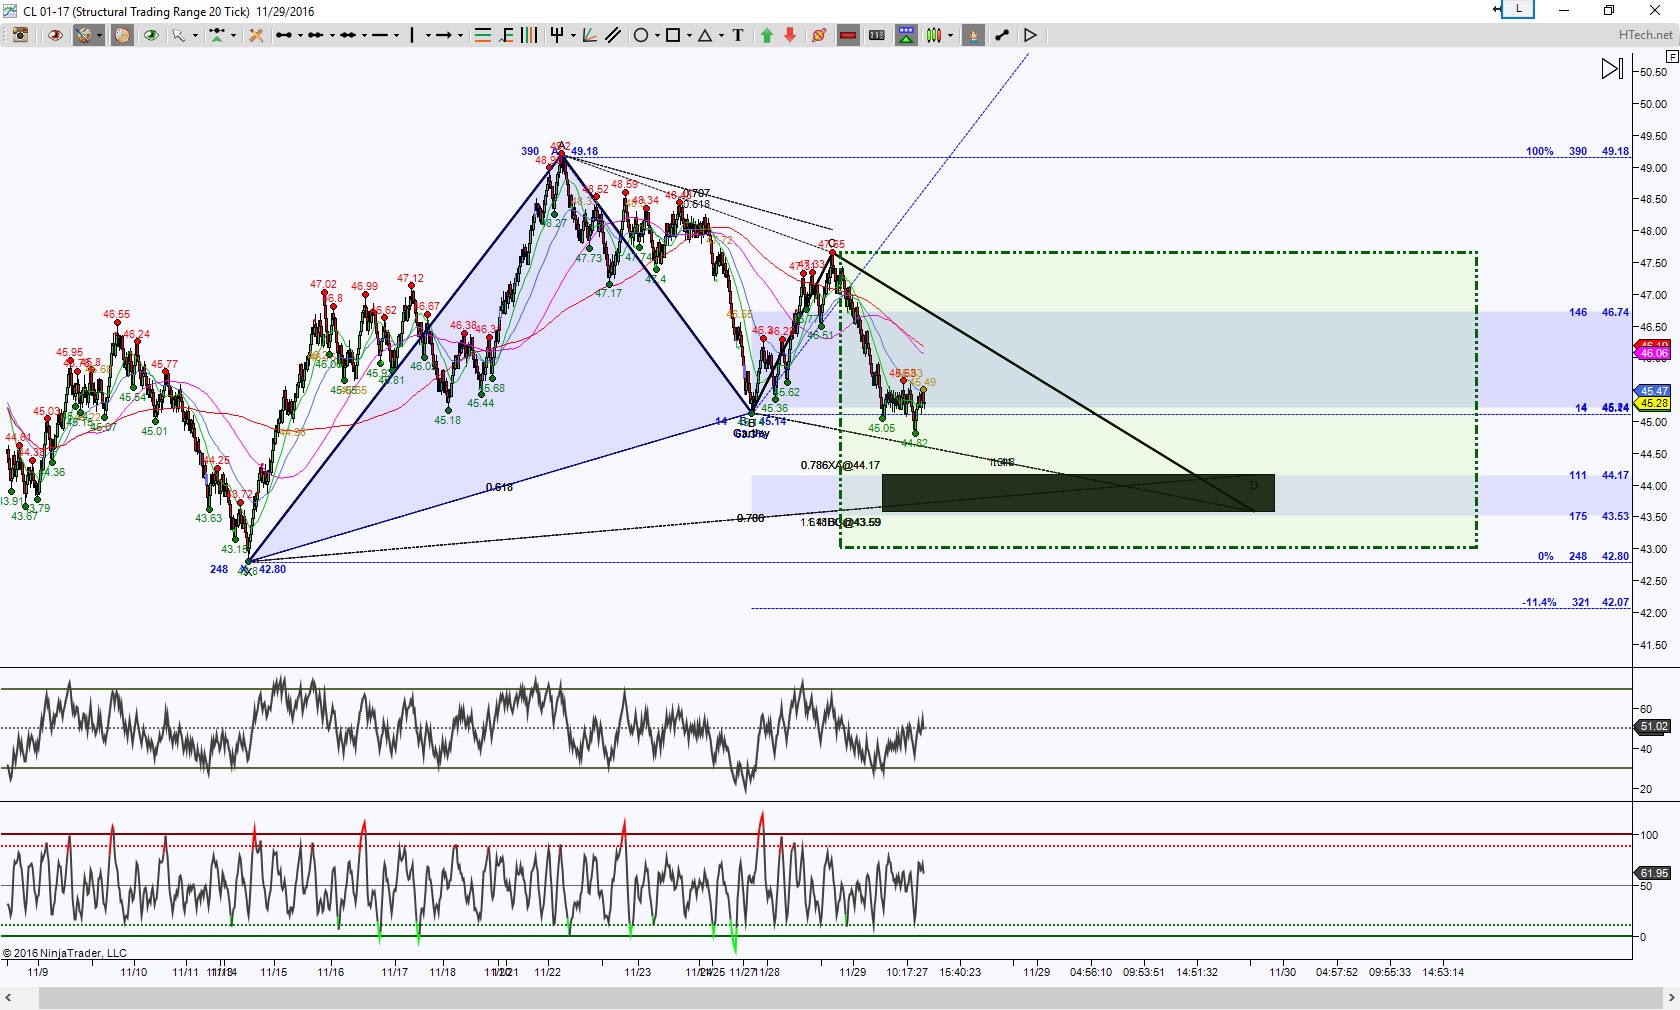
As for an intraday perspective, I’m looking at STRange 20 bar chart. I’ve drawn the Day chart’s GRZ with green on this chart to show how price is pretty much right in the center of the GRZ. On this chart there is an emerging Gartley pattern with the PRZ at the black zone (44.17 to 43.59). And price is stalling at the GRZ midpoint which correlates with the triangle midpoint (I consider this a Significant Level) at 45.14, so this is the initial level to hold above or below and currently there’s no conviction either way.
But a hold below 45.14 increases the probability of completing the Gartley and testing the bottom of the Day GRZ. A hold above 45.14 needs to hold above 45.63 for starters but if can do that then both the blue and green GRZ tops are the targets to keep eye on.
Trading involves substantial risk and is not suitable for all investors. Past performance is not indicative of future results.


