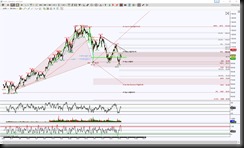
Or should I say AAPL likes Bats because that is a reoccurring pattern on my chart? Looking at the Day chart, the HPCollection shows there’s a Bullish Bat PRZ at 96.97 that price is attempting to make a decision. The initial test offered the greatest bounce, with the second test creating a lower high which is a yellow flag for upside Retracement Mode, it’ll need some oompf to hold above 112.39 previous bounce point.
I’ve added a larger formation using my STZones indicator which shows a brown colored emerging Bat. This also shows the GRZ (Golden Ratio Zone aka the 38.2% to 61.8% area) that price is also caught inside. My rule of thumb is wherever price can break and hold beyond the GRZ offers a directional bias. In this case there is a Double GRZ level at 104.16 and depending on when price tests it, could have the D200 convergence there.
So three distinct levels to watch for are 96.97 (to hold above or below), 104.16 (if price can hold above there increases the probability of testing the gray levels) and 92 ( a hold below there increases the probability of completing the brown Bat).
Trading involves substantial risk and is not suitable for all investors. Past performance is not indicative of future results.

