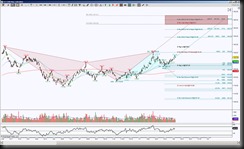
TLT, the ETF for 20 Year Bonds completed a Day chart Bearish Bat in February 2016 followed by a shallow retracement of only 38.2%. This Bat is shown on the Day chart colored brown. Now there’s another emerging Bat, colored cyan that has a completion target of 119.97. This cyan Bat will help the brown Bat have a more respectable retracement of approximately 78.6%.
I love how harmonic patterns interact with one another and help each other play out. This chart has many converging scenarios going on, but I’m going to focus on the these two that I have on the chart.
Currently price has an upside bias but needs some conviction to hold above 135.25 then more important 138.50. IF price can do that, the probability increases to test 153.10, this is a Double PRZ region so behaves as both a magnet and probable rejection area once price has arrived.
But that’s getting way ahead of the current situation. Due to expansion, there’s probable stall or pull back into 129.5 to 127.1 area, this will be a very important support test and as long as price can hold above it, the 135.25 keeps calling price to it. A hold below 127.21 has an initial target of 124.59 but ideal targets at 119.97 or 107.34.
Trading involves substantial risk and is not suitable for all investors. Past performance is not indicative of future results.

