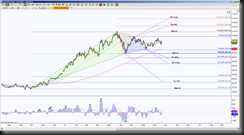
Using the USD/JPY currency chart gives indication of the Japenese Yen price behavior as well as the strength of the US Dollar.
The daily chart shows extreme indecision. The current sideways range is constricting, creating opposing emerging patterns. What this does is gives us targets whether price stays sideways or breaks important levels that can make or break one of the opposing emerging Harmonic Patterns.
The initial sideways range extremes are 101.52 and 95.44, a break and hold … this is a daily candle close beyone one of these levels followed by continuation in that break direction … of these levels then has the larger sideways range extremes and Harmonic Pattern invalidation potential.
So, a close above 101.52, first of all invalidates the blue emerging Bullish Butterfly and Crab Harmonic Patterns, then secondly has the initial resistance test of 103.73, a hold above there invalidates the green emerging Bullish Bat Harmonic Pattern, and finally has the ideal target at 109.88 with scaling point at 106.44.
A hold below 95.44 has an initial support test at 93.78, below there invalidates the brown emerging Bearish Butterfly/Crab Harmonic Patterns and has the ideal target at 80.43 with scaling points at 91.67, 89 and 83.06. Notice how the completion of the blue Butterfly and Crab help price push below the significant level 93.78, which increases the probability of completing the larger pattern.
******************************************************************************************************
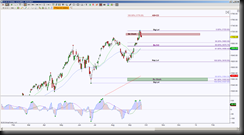
ES_F breached a Bearish Shark Harmonic Pattern’s ideal completion zone, aka PRZ (Potential Reversal Zone) but two things of interest occurred after that breach … one, price has so far failed to hold above the top of the PRZ, and two, price is attempting to hold below the bottom of the PRZ.
Most Harmonic Patterns require a failure to make a higher high or a lower low … But Sharks and 5-0’s do. The 5-0 does represent a 50% retracement after a higher high has been made … there are specifics of course with how much pullback before making the higher high (in this case) and how much of a higher high it is … but back to our daily chart, if price goes into retracement mode of the Bearish Shark, the ideal target is the 50% mark to form the Bullish 5-0 Harmonic Pattern. This level is 1670.75 … so the GRZ (Golden Ratio Zone) is the initial support test at 1683, this will help price fill that gap.
It is possible that price breaches the 1670.75 level to test the bottom of the GRZ at 1658.50, the important thing is if downside continuation occurs … if so, the ideal target is another Shark PRZ, but this Harmonic Shark is bullish. Then we can seek another 5-0 scenario, but for now, price is at a stall place or pullback into support scenario, so as long as price holds below 1708 (bottom of bearish Shark PRZ), the bias is to downside … at least to 1683 or 1670.75. Not until price can hold above 1723, does the bias have upside target to 1770.25.


