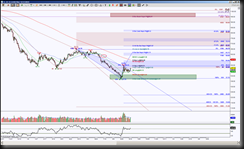
Crude oil futures Day chart shows there was a bullish harmonic pattern completion at 37.75, called a Crab, this particular pattern has reached it’s ideal minimum retracement target area of 47.62, if the retracement mode continues, there are distinct targets of importance in the world of harmonics, namely in this particular case, this 47.62 is important, as well as 54.46, 61.71 and 64.79. Pay attention to these levels because the are twofold in their purpose, one to gauge the strength of a bullish pattern and two, to help push price upward to perhaps larger harmonic pattern targets. There is a Shark pattern completion zone at 95.01, this will be the next ideal target when the initial retracement targets are exceeded. The downside to this scenario is that if price cannot push above this 47.62 then it’s considered a shallow retracement and suggests a stall or retest of the green colored zone. Downside continuation from there has the noted ABCD targets … yikes!
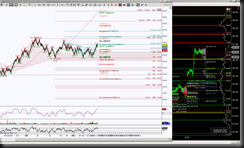
Looking at the intraday perspective, in this case an STRenko 30 bar size, shows a small harmonic pattern, colored cyan, has completed at 47.34, this intraday target helped price test the Day chart target of 47.62. So watch for this intraday pattern to retrace downwards and whether price can hold below 45.83 then more important below 44.88, if so this helps keep price below that Day level. This chart has an ideal target of 39.07 with potential breach to 37.75 and this will help take price back to that Day level at the bottom of the green colored zone. The intraday targets of 36.44 and 30.59 offer scaling points to the Day ABCD targets.


