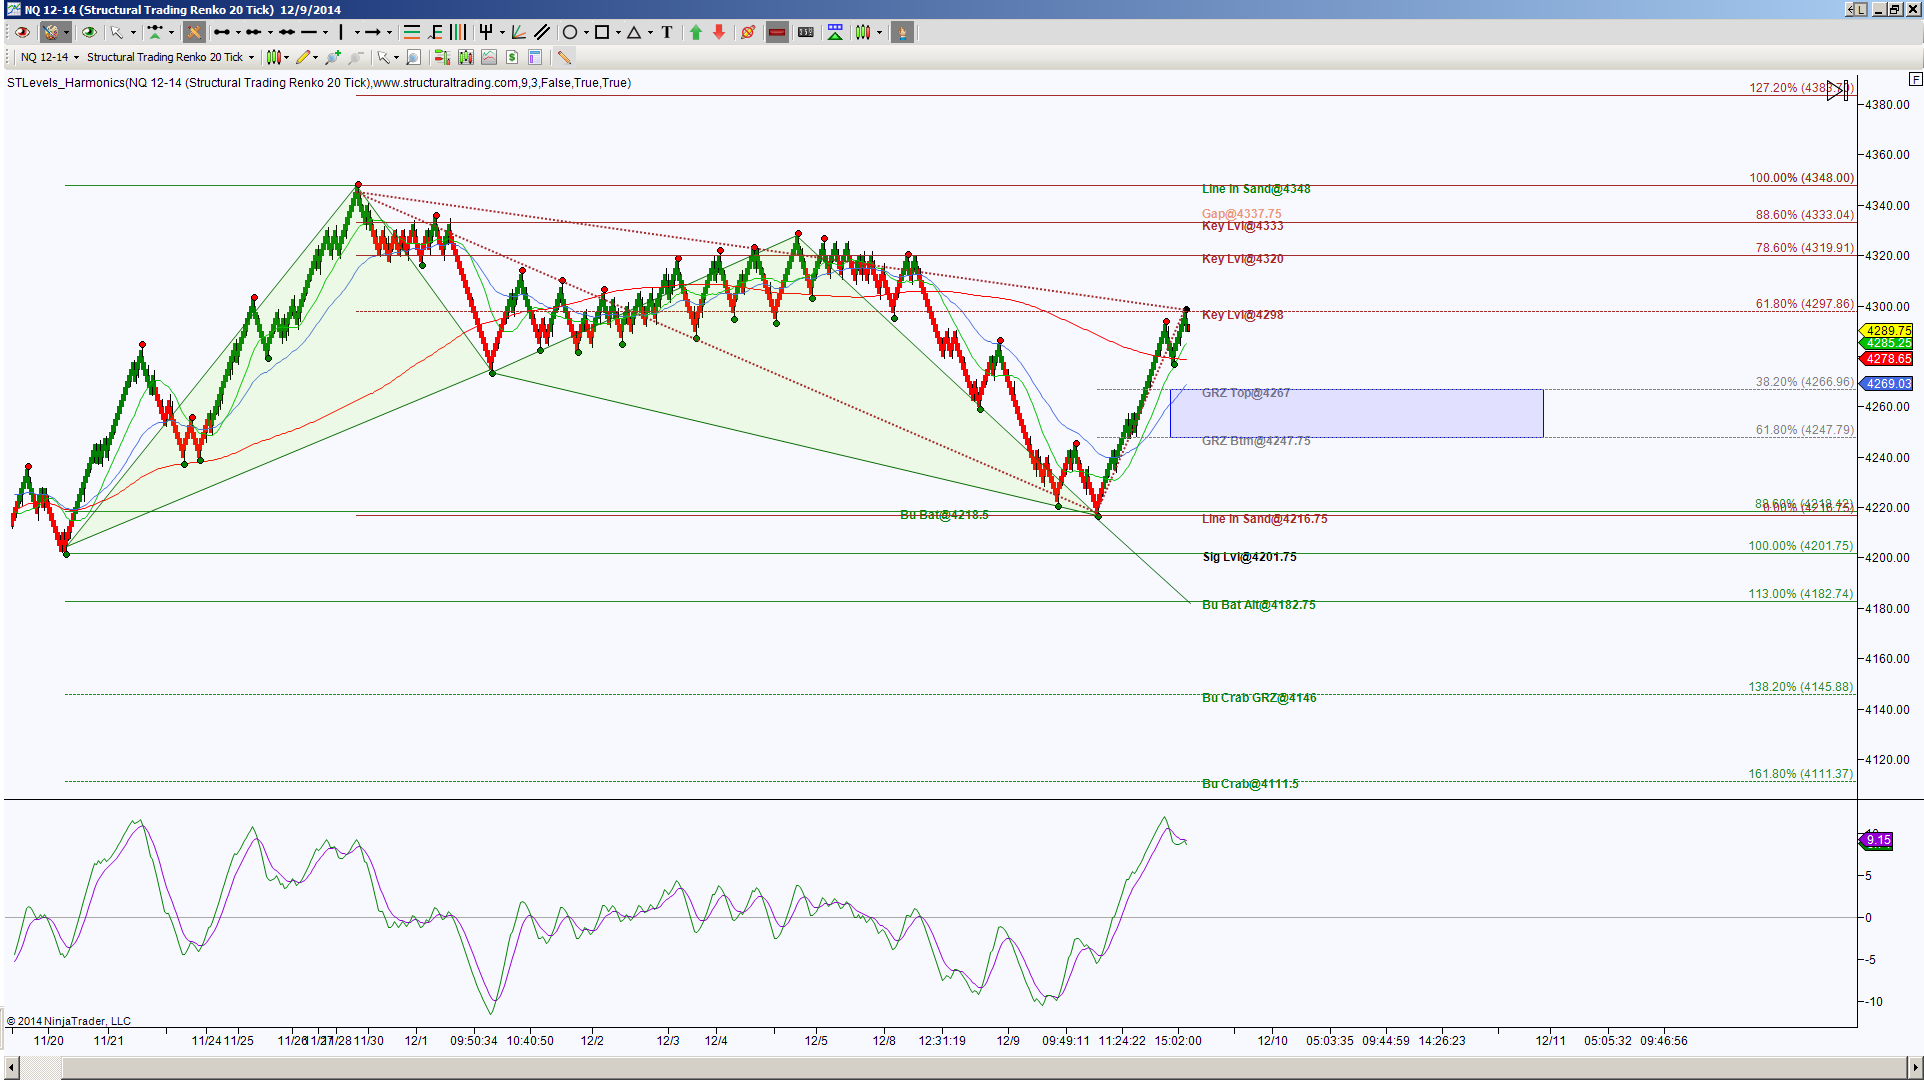
This intraday perspective chart, in this case an STRenko 20 bar, for Nasdaq Futures shows price is in retracement mode of a bullish harmonic pattern called a Bat. One of the interesting aspects of harmonic patterns is they are always forming. Even with this retracement, there’s an attempt to form a new harmonic leg. Specifics within harmonic rotations determine when the pattern increases in probability.
In this case, a hold below this key level at 4298 has some confluence for a pull back into a support target at 4267. This particular bar chart shows an upside bias while price is in retracement mode and this bias has a potential shift to the downside if price is able to hold below first 4267 then more important below 4216.75.
Depending on whether price is able to reach at least 4267 determines whether a new harmonic rotation begins utilizing the 4298 level as one of the three triangle points that create the initial three levels of a harmonic pattern. Case in point, look at the green triangles for that Bullish Bat, the first triangle on the far left side of the chart is what I’m referring to, and once that triangle formed, I immediately had 4218.5 as a downside target for that Bat. Is this voodoo? Well, there was someone who once called it that, but realistically, it’s simply symmetrical rotations and cycles, just like everything else in our world. Technical analysis offers probabilities, no certainties and harmonic patterns are a great method of determining risk, targets and entries that have a probability in playing out. But I digress.
Back to the chart, a pull back and hold above 4267, or a hold above 4298 offers a long opportunity to 4333 and a scaling point at 4320. Harmonic patterns dream of retracing 100% and 4348 is the 100% target for that Bullish bat, anything above there gets into extension targets, namely 4383.75 and 4429 are key extensions.
It’s always a great idea to be prepared for the opposite direction, after all human input, worldly affairs, etc have unforeseen influence upon our markets. So looking for a bias shift to the downside would mean, to me, that price is holding below 4267, this would imply a retest of 4216.75 aka that Bullish Bat PRZ (Potential Reversal Zone) and failure to hold there has the extended targets of 4182.75, 4146 and 4111.50. These extension targets by the way, were noted on my chart the moment that first green triangle was valid.
So for me, harmonically speaking, I’ll be first watching to see if price can get to 4267 and what occurs there, as well as if price holds above or below 4298.
Trading Futures involves substantial risk & not suitable for all investors. Past performance not indicative of future results.

