Back in April of this year, I was watching the ETF for US Real Estate, (click here for that post), IYR to either push above 83.56 for 85.5 target or below 76.36 for 69.59 target. Well, I’m always in awe of harmonic pattern rotations and this time is no different. That 69.59 target has been achieved and IYR is at a decisive point juncture.
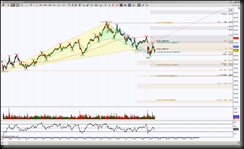
This day chart shows the Deep Crab harmonic pattern completed at 69.59, there was a slight breach below the ideal target, but then attempted a retracement to the upside. The ideal minimum target is 74.11 and ideal target is 83.54. So far the retracement has been embarrassing aka a shallow retracement. This implies a retest of 69.56 or if price can push and hold above 71.07, this would increase the probability of testing that 74.11 target, it will be at this juncture that I’ll be watching to see if price can hold above there because every resistance level I have on my chart, that price can push and hold above, increases the probability of reaching the ideal target of 83.54.
However, this chart shows the bias is to the downside and failure to have a respectable retracement is a sign of weakness. I have a larger harmonic pattern in the works, colored yellow, that does have lower targets, the first at 63.50. Now, there’s some convergence there so that tells me it’s a probable stall or bounce point and a determining fork in the road as to whether it’s retracement mode time or downside continuation to extended harmonic pattern targets.
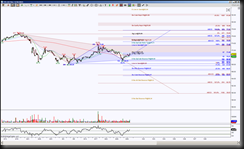
For the intraday perspective, I’m using the Hour chart, price is in between two opposing harmonic patterns with a slight upside pull for an intraday bias. This is not in sync with the Day chart bias, thus the decisive juncture for IYR. Note I’ve left the Day chart levels on this intraday chart.
There are distinct targets in either direction that have my attention, but first I want to see if price can hold above initial levels or support or resistance to increase the probability of testing those noted targets.
Above 71.49 has the ideal target of 74.89, this will have convergence of an intraday Gartley (brown) and an intraday ABCD (blue) completion which helps that Day Deep Crab meet its ideal minimum retracement target. Convergence is when a region is a target by different rotational means, and if I’m long with a hold above 71.49, I will definitely take profits or prepare to exit at that 74.89 area.
Below 70.27 has a retest target of 69.30, this correlates with the Day chart retest of the Deep Crab target. Failure to find buyers to push into retracement mode does have an ideal target of 65.07 and scaling points at 68.28 and 66.87. Note that if price is at the 65.07 target on the Hour chart, this will put the price into the vicinity of the Day chart’s next harmonic target of 63.5. Again, convergence.
So initially watch for a hold beyond either 71.49 or 70.27, then refer to the targets as outlined above.
Trading involves substantial risk and is not suitable for all investors. Past performance is not indicative of future results.


