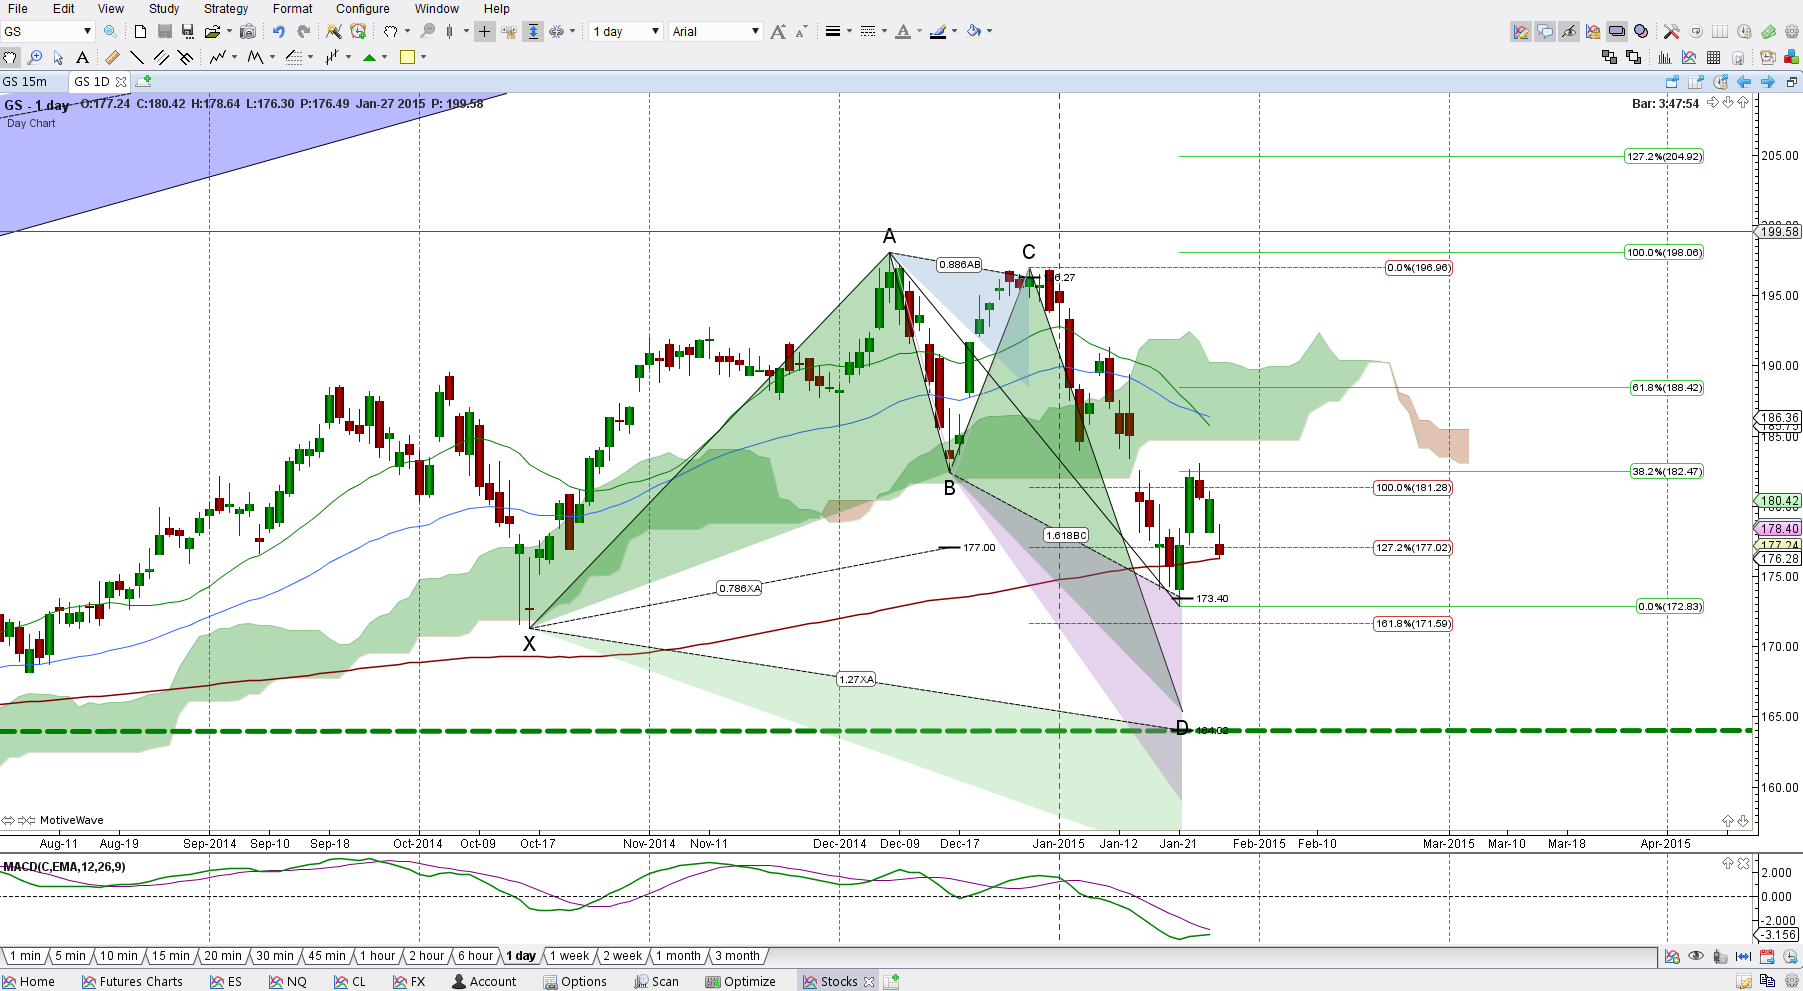
Goldman Sachs (GS) is at a decision point. Price fell below an important 182.41 support line to complete a harmonic pattern. Now stalling, the decision to retrace a bullish harmonic pattern or break down to complete a pattern which has a much lower target can be influenced by either a hold above 182.47 or a hold below 177, then 172.83. Let’s look at GS next to the Financial Select Sector Index, there’s also an ETF that follows this index, called XLE .
The left chart is the Index and the right chart is GS, from a day perspective. If you’re familiar with Ichimoku Cloud then you understand at a glance, if not, in the most basic of terms, where price is in relation to the cloud offers key support and resistance regions. So with that said, notice that price is inside the cloud on the index chart and GS is below its cloud. That suggests as it is that GS is weaker than the sector. Whether GS can follow the leader of the pack back inside the cloud is initially determined if price can hold above it’s current range resistance of 182.47.
Harmonically speaking both charts have a downside target where the green dashed line is, so for increased probability in reaching the completion target, for IXM, I’ll want to see price get below and hold below the bottom of the green cloud, then below 6329.96 and for GS, to hold below 176.28 then 171.59.
Although IXM appears stronger than GS, to look at it by itself, it does have some weakness unless it can hold above 6519.29 then more important above 6636.25, if so then the ideal upside target is 7100 to 7131.87.
As for GS, it needs to hold above that 182.74, then more importantly above 188.42 to increase the probability of retesting the 196.96 and 198.06 levels. There is a much larger harmonic pattern that has a completion target higher at 228 but first things first, let’s see if it can push above that cloud.
Trading involves substantial risk & is not suitable for all investors. Past performance is not indicative of future results.


