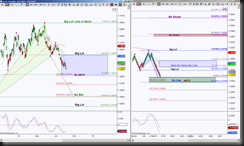
Euro FX Futures shows price in downtrend approaching key levels. The left chart is a Day bar size which shows price has confluence target at 1.3231 to 1.3214 region, harmonically speaking this would ideally be a scaling point in route to the harmonic pattern completion target 1.2900. So this bigger picture scenario suggests daytrading short setups have a higher probability of playing out vs the counter trend scenario.
The left chart is an intraday perspective, in this case I’m using an STRenko 10 Bar size. This shows price is testing the top of a double bullish PRZ (Potential Reversal Zone aka the completion target for harmonic patterns), since it is double, there are two separate patterns which merge into a zone. The ideal target is 1.3297 however there are indications of a stall or bounce into resistance. The bounce into resistance strategy offers a higher probability entry thus having less risk involved.
Since the bigger picture is saying look for areas to enter a short because the ideal target is 1.2900 but there’s opportunity to lock in profits at 1.3214 and 1.3080, then when price is testing a support region in an intraday view, a conservative approach is to see if price can bounce into either 1.3339 or 1.3351 and a hold of those tests offers a short opportunity to retest 1.3314 or to the ideal intraday target of 1.3295, a break down there has extended ABCD targets 1.3268 ad 1.3229. Note how a completion of the ABCD 1.618 at 1.3229 places price at the day chart target of 1.3231 to 1.3214 zone.
Keep in mind there’s nothing preventing an entry at 1.3314, however to do so requires a risk above 1.3339 or ideally above 1.3351, so if a trader’s risk tolerance is uncomfortable placing a stop that much, then it is suggested to wait for a bounce and hold of resistance before entering.

