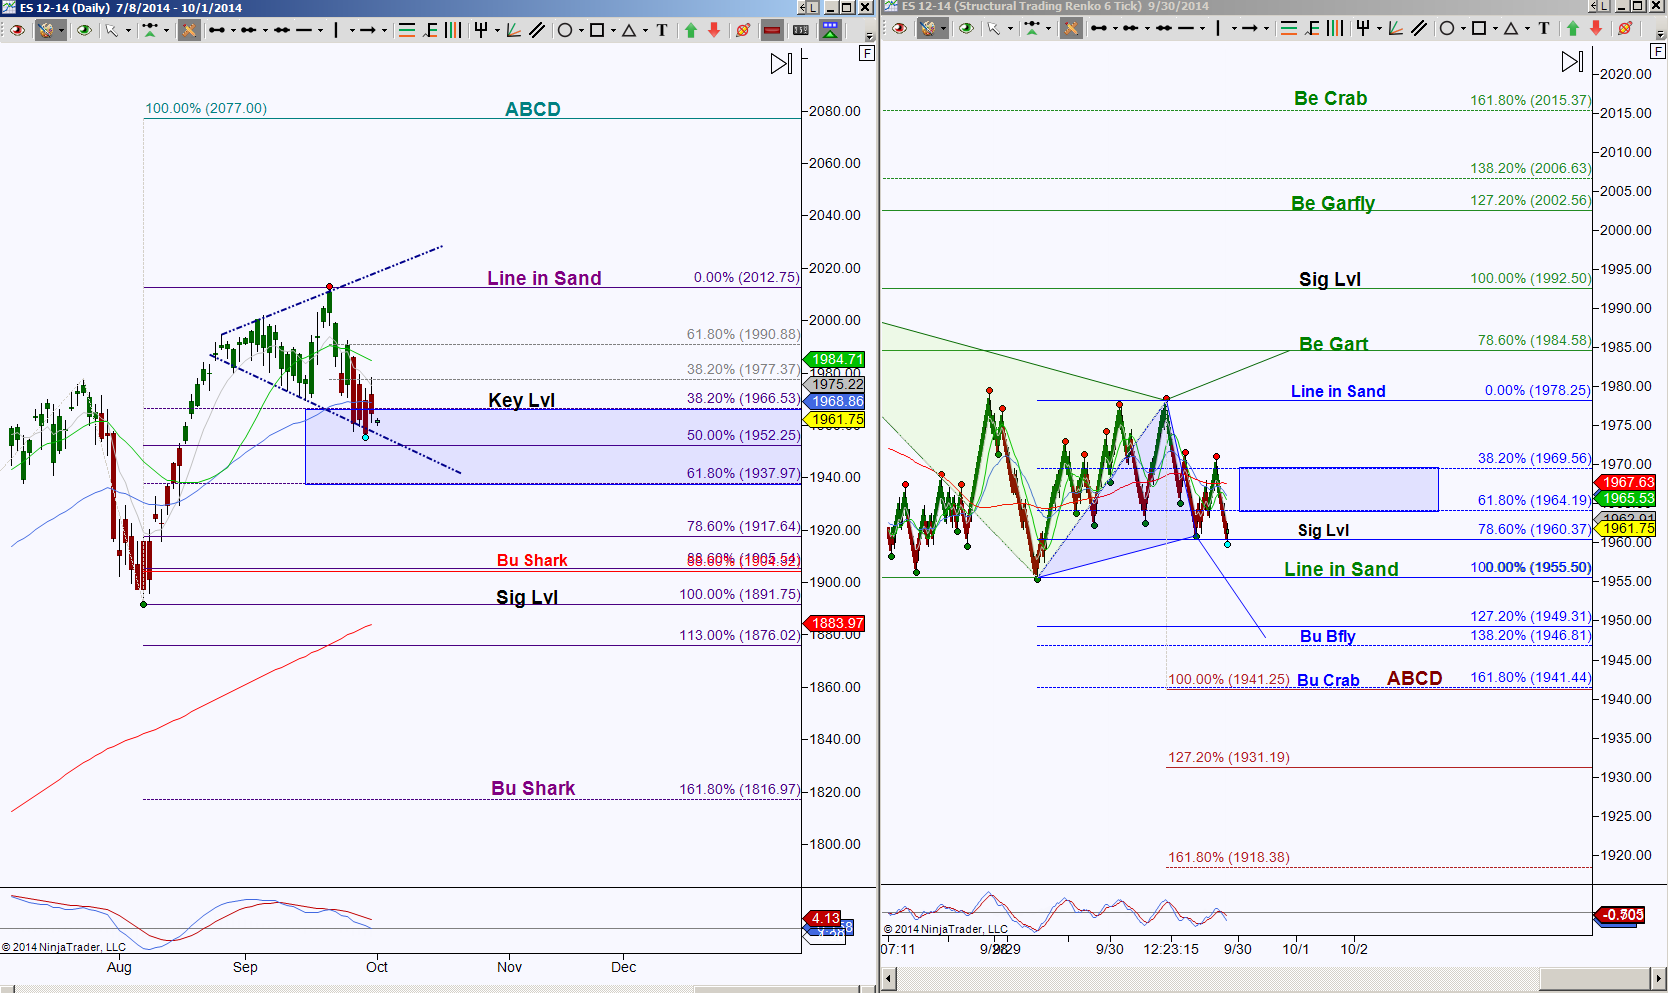
S&P 500 Emini Futures is currently testing a megaphone support line which correlates with a GRZ (Golden Ratio Zone aka the area between Fibonacci ratio’s 38.2% to 61.8%) and an attempt to invalidate a bullish cross. There was bearish divergence with that 2012.75 high so there are clues of weakness but follow through is a must.
Let’s talk through the technical analysis of what the day chart, on the left, is describing. A bullish cross was initiated in August of 2014 and price has honored the upside bias, however recently price has attempted to invalidate this bias by way of holding below 1969. This is near the GRZ level of 1966.5 and so far price is below both of these levels, and the longer price holds below them, the higher the probability is of testing lower targets. I always leave key components of harmonic pattern scenarios on my charts by way of a Fibonacci or the title of a harmonic pattern at its completion target aka PRZ (Potential Reversal Zone), so each Fibonacci level that price holds below it increases the probability of not only testing the next Fibonacci ratio but also completing emerging patterns, in this case the nearest harmonic PRZ targets are either 2077 for an ABCD or 1905.5 for a Bullish Shark. Another component to this higher timeframe chart is that price is in a megaphone, and even though price is expanding with higher highs and lower lows, the formation is still a consolidation behavior. At some juncture, should price continue to walk down that megaphone support toward the beginning of the formation at 1891.75, the megaphone evolves into a reversal scenario and we can eliminate the megaphone.
Should price be able to hold back above 1966.5 and push upwards back toward the top of the megaphone, then this consolidation pattern remains valid and the 2012.75 becomes a probability target.
Now lets look at what is going on from an intraday perspective as shown on the right side chart, this is an STRenko 6 bar size I personally prefer for intraday harmonic scenarios. This chart shows price is in between opposing emerging harmonic patterns, this means that ES has two emerging patterns but in order to complete one, the other will be invalidated. This is typical when price is in contraction, consolidation or indecision mode. The Line in Sand levels are the do or die area for that color coordinated pattern, in other words, if price goes below 1955.5, that Line in Sand is green so the green colored pattern is invalidated thus will no longer exist in this chart. The same goes for a breach of 1978.25, which is blue, the blue triangle, fibs and harmonic pattern titles will be removed.
So which one has the higher probability of completing and which one has a higher probability of being eliminated? The initial clue is I have red bars with a downside cyan dot, this tells me price is still forming the downside move from the most recent high, another clue is price is holding below the GRZ level 1964.25. These clues tell me I have a downside bias and that if price can hold below 1960.5, then my next target is 1955.50 and there we will be, at the Line in Sand test. If you’re familiar with basic TA (Technical Analysis), then you’re undoubtedly aware of a double bottom and that can be a bullish setup. There’s always a lot of “IF’s” in the markets, and that test of 1955.5 creates two primary “IF” scenarios.
IF price holds above 1955.5, then the ideal target is 1984.5 and scaling points at 1964.25, 1969.5 and 1978.25. I consider scaling points as areas of potential rejection so they are good places to protect a profitable position.
IF price holds below 1955.50 there is a double PRZ target of 1941.5, a double PRZ means that two different harmonic patterns have a completion target very near each other, this creates a magnet for price as well as a stronger probability of being a rejection point, so that would be my ideal target and scaling points at 1949.25 and / or 1946.75.

