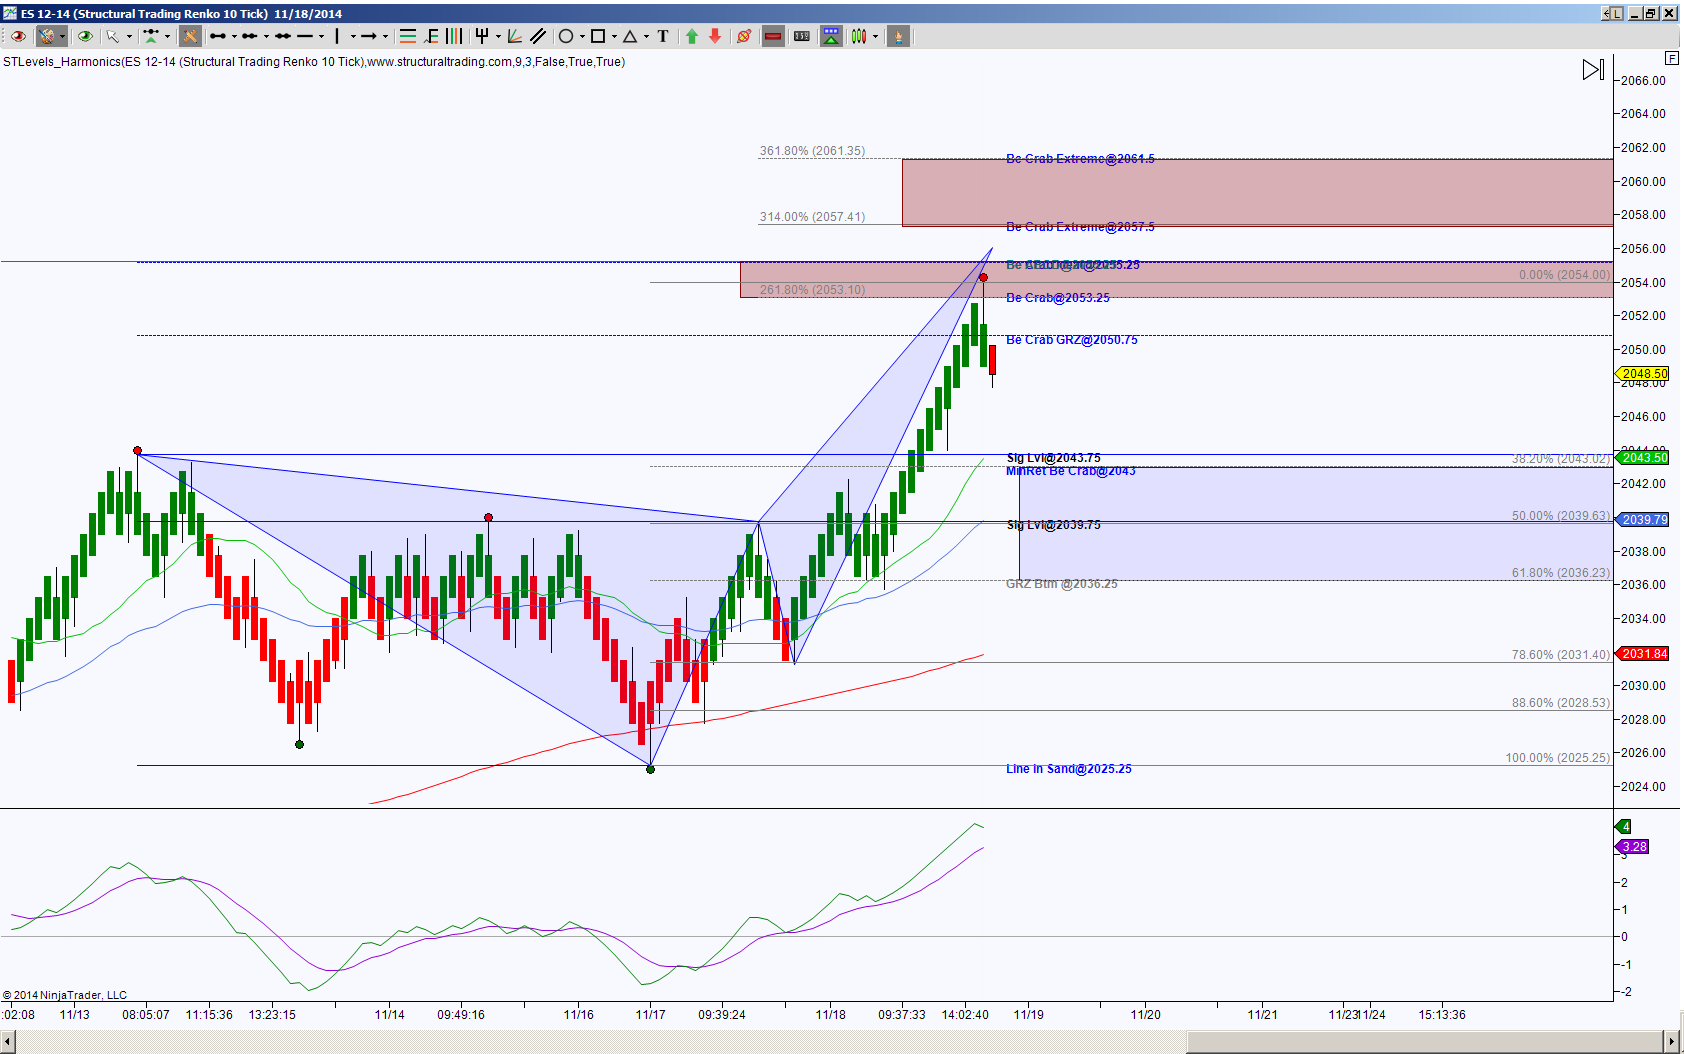
ES Emini futures completed a bearish harmonic pattern at 2053, once price held below 2053.25 and more important below 2050.75, the probability increased in a retracement attempt. The ideal minimum retracement target is 2043 and the ideal retracement target is 2025.25.
The initial pull back target of importance, harmonically speaking, is 2043.75, this is close to the ideal minimum retracement target. This region will be an important support test because if it holds price up, it represents a shallow retracement of a bearish pattern, which implies either a retest of the PRZ (Potential Reversal Zone aka a harmonic pattern’s completion target) or an attempt to test extreme or extended targets at 2057.5 and 2061.5.
A hold below 2043, like I said has an ideal retracement target of 2025.25. This is because every harmonic pattern’s dream is to retrace 100%, this of course is me putting a personality into a harmonic pattern, but every harmonic pattern trader does have an awesome feeling when they’re in the retracement trade and it goes to that 100% mark. Back to the chart, every retracement Fibonacci ratio has importance, not only do they gauge the strength a potential reversal pattern, but also each ratio gives a heads up for a new harmonic rotation. That being said, every gray fib shown on the chart offers a scaling point, a potential bounce point, or exit point. Knowing this offers discretion to the trader to either protect their position, seek a new position, or offer more wiggle room for a bounce in a downside bias.
I like moving averages, they offer some juicy details of the conversations occurring between buyers and sellers at confluence with my levels, so you can see on the chart, one of my moving averages correlates with the 2043.75 Significant level, one correlates with the 2039.75 Significant level and one correlates with a 78.6% retrace target at 2031.5. This gives more importance whether price holds or breaks down at these regions.

