The energy sector ETF shows there’s been some intraday upside bias but does it have enough power to keep going?
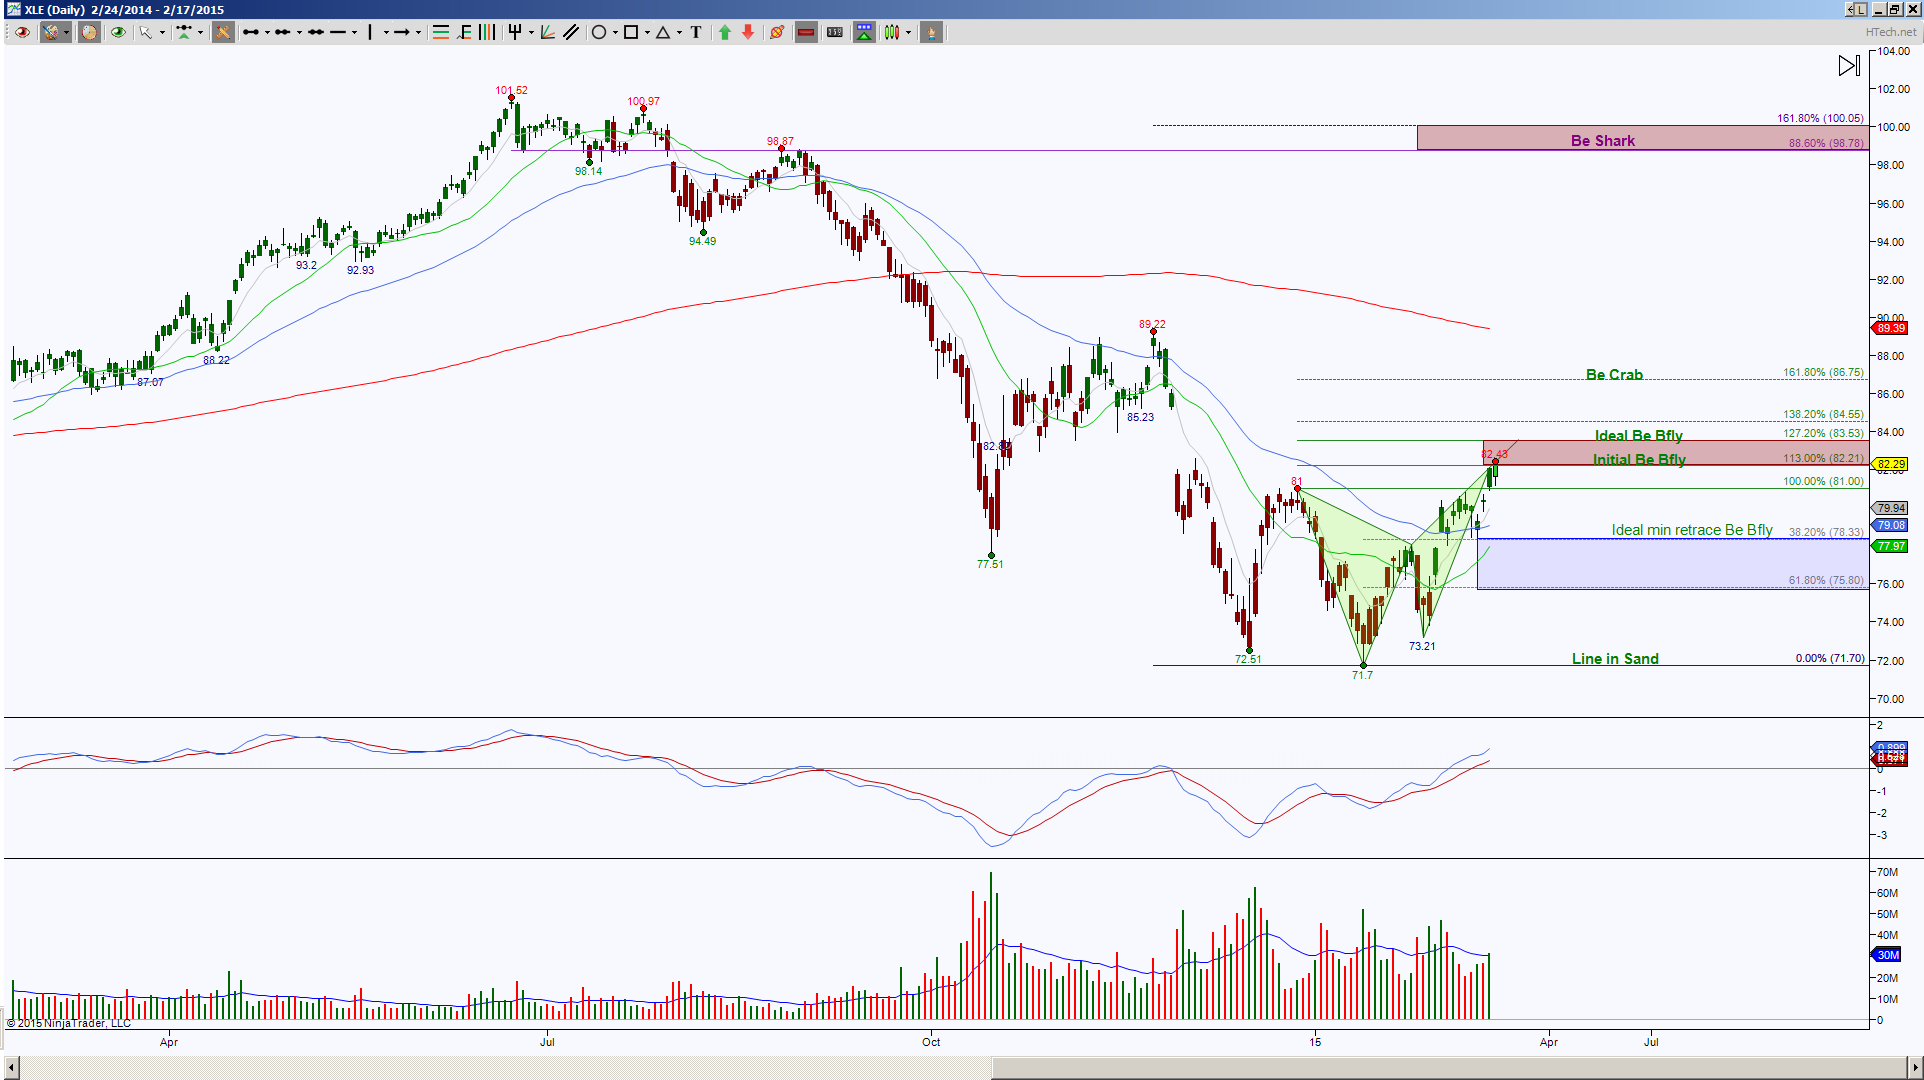
 The day chart shows price is testing a harmonic pattern completion zone between 82.21 and 83.53. Price is extended for this time frame, so this typically implies a stall or pull back into support. How much it pulls back is key because a shallow retracement, in other words if price cannot push below 81 or breaches it to test 79.08 or 78.33 but is able to hold back above 81 is an inclination of upside continuation.
Since the over all bias on this day chart is downside even though price is bouncing some, I want to watch how price behaves at these green colored targets because they offer clues. On the one hand a completion of the Crab at 86.75 will help price fill a large open gap but the daily 200 and previous high of 89.22 convergence will be a level to reckon with. Those will be definite scaling targets for long positions and very important resistance tests. An ability to hold above 89.22 will then increase the probability of completing a Shark pattern which has a target of 98.78. This region will help price retest the 101.52 high.
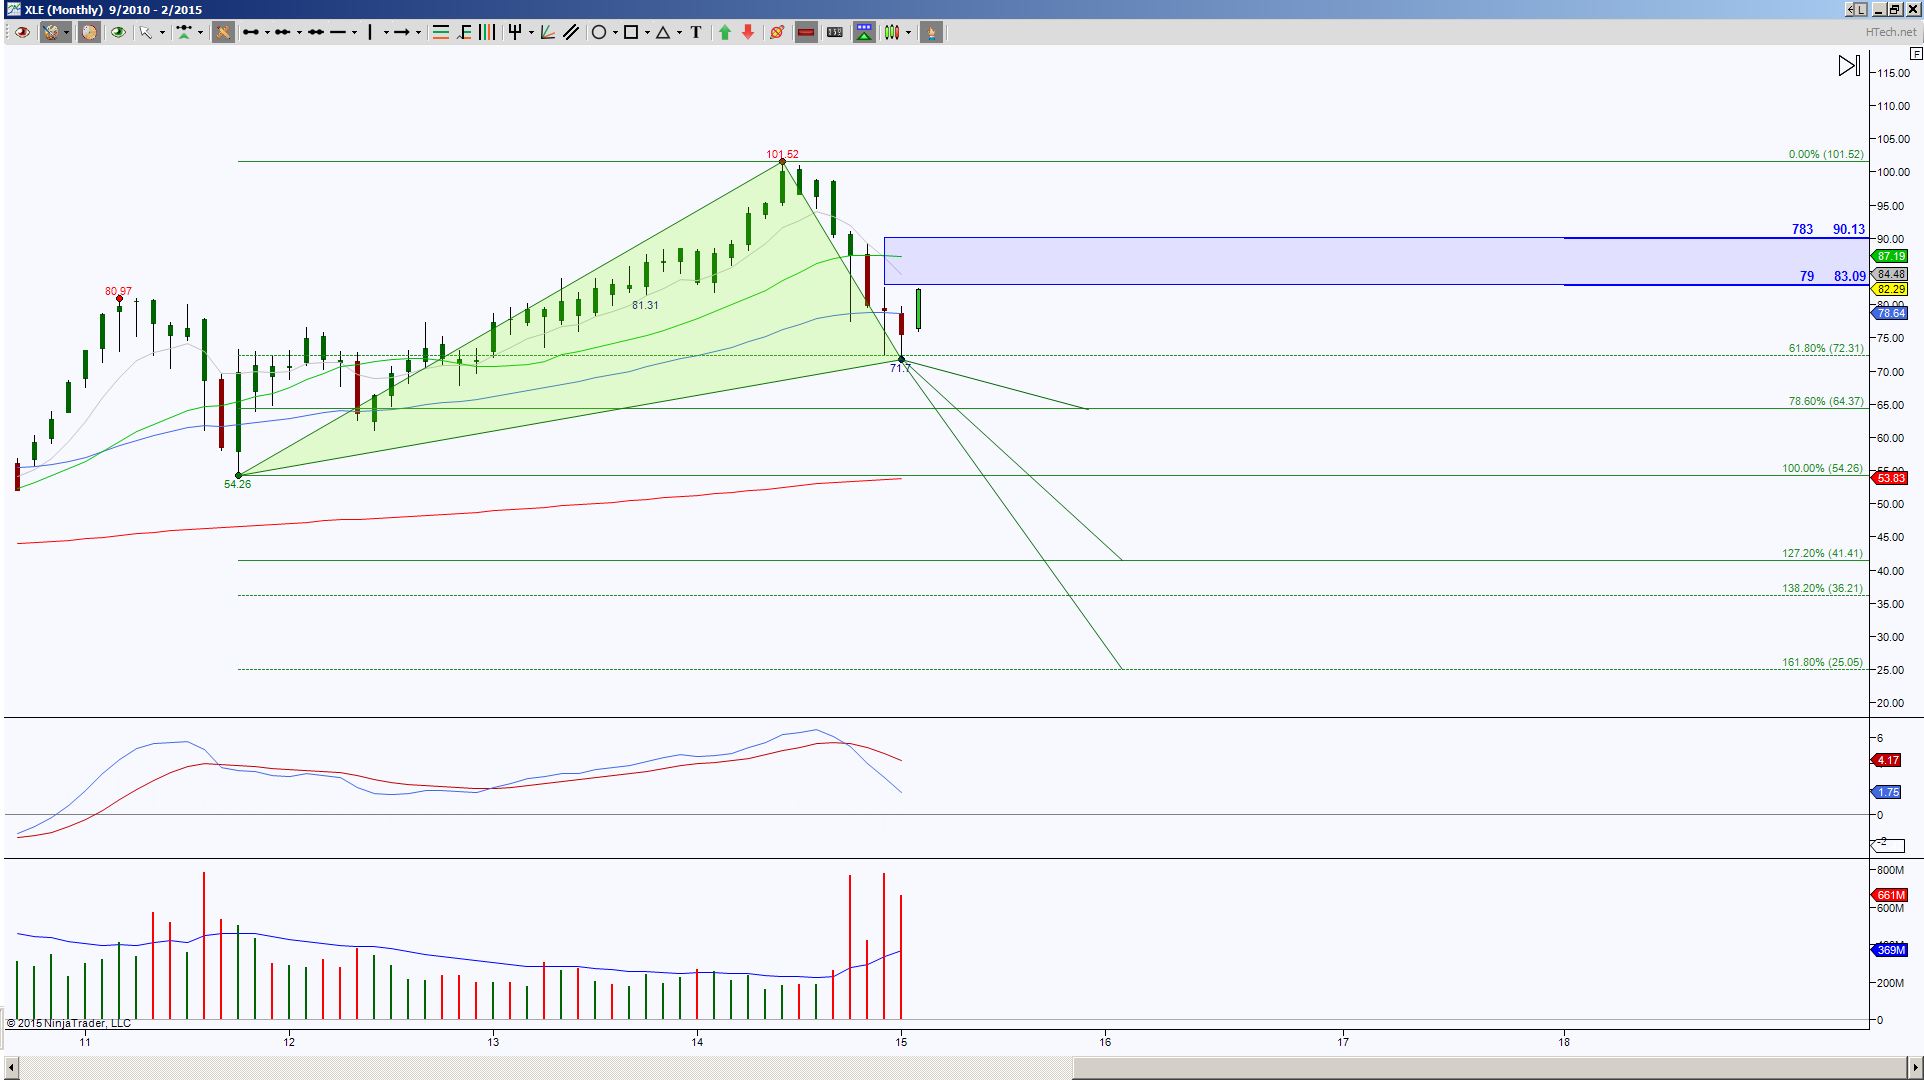
On the other hand if price rejects these upside targets or holds back below 81, then I’m looking for lower targets of 64.37, 41.41 and 26.05 as shown on the month chart below.
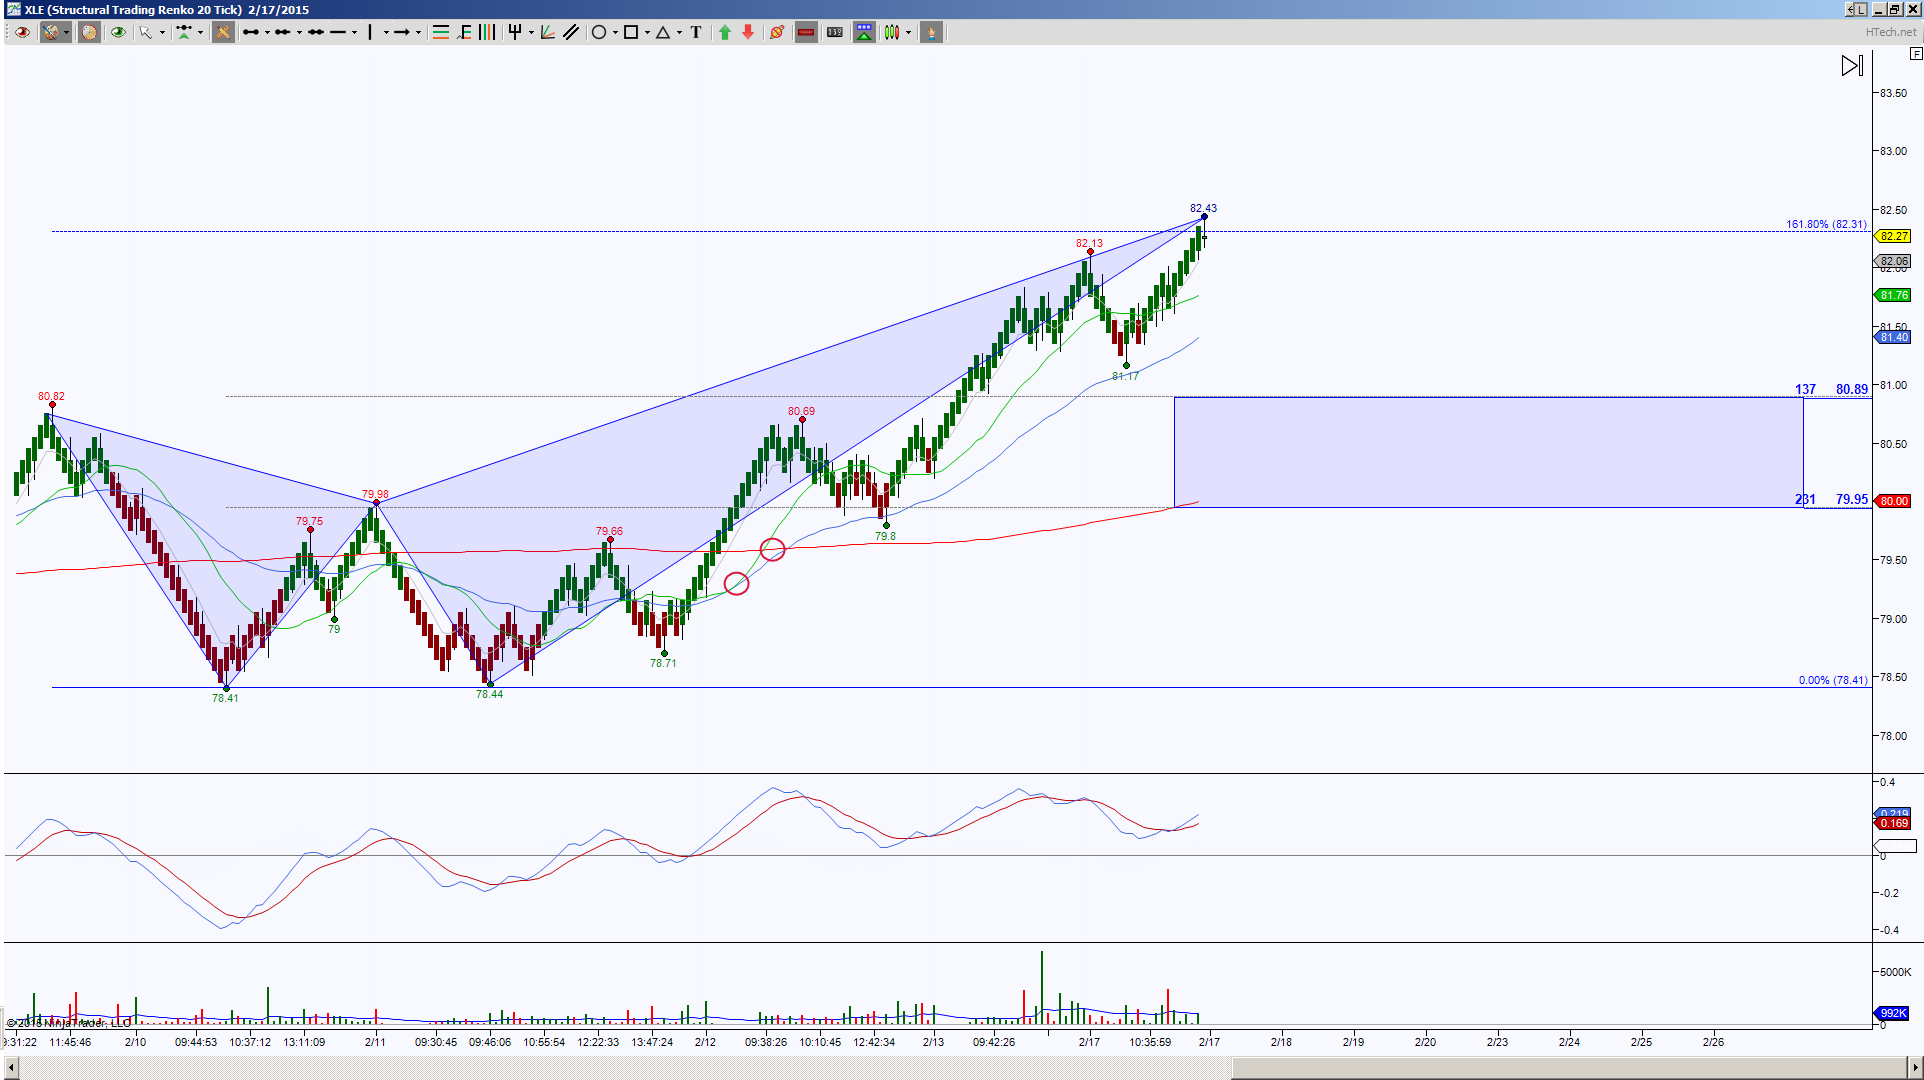
 For an intraday perspective there is some strong convergence with the day chart at this current region of 82.31. I’m using an STRenko 20 bar intraday chart and this shows price has completed a bearish pattern as well at 82.31. So this offers stronger resistance region implying a probability of a retracement attempt, on this chart those pull back targets are 81.76, 81.40, 80.89 and 79.95. If these hold as support it’s considered a shallow retracement and suggests another attempt to push higher.
 How these different charts relate to you depends on what type of trader you are, a swing trader will look at the month and day charts, while a day trader will benefit more from the intraday chart. But it’s always interesting how the smaller timeframe/bar size charts’ harmonic patterns are great at helping the larger patterns play out. Watch for convergence levels derived by different patterns and it offers a higher probability rejection point.
Trading involves substantial risk and is not suitable for all investors. Past performance is not indicative of future results.
