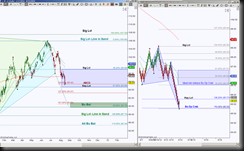
Crude Oil Emini Futures shows on a bigger picture that price is in between opposing emerging patterns while a double bullish pattern offers a bounce into resistance scenario.
 The left chart is the bigger scenario using day candles, the left side is for an intraday perspective using an STRenko 30 bar size. The day chart shows that price was in a consolidation period while toying with a 200 moving average then a break down of that consolidation to complete an ABCD pattern at 95.42. There are indications that price has a probability of stall or bounce into resistance and the intraday perspective will offer a zoomed in view.
From the STRenko chart’s view, the first thing to notice is the completion of a Bullish Deep Crab at 95.30 correlates with the day chart’s ABCD completion which offers a probability of bounce with the initial levels for price to break and hold at either 95.77 or 95.30. An upside break offers a long opportunity to 96.53, above there has an important target of 96.92 which could present a shift in the intraday bias with a hold above there and increases the probability of testing higher retracement Fibonacci levels. Note that a 100% retracement of this Bullish Deep Crab, as shown in blue on the intraday chart, will help price push back above the 200 on the day chart and increase the probability of testing that significant level 98.98.
A break down of 95.30 makes a statement for the bears on an intraday perspective, especially if price can hold below 94.68, if so the ideal target is 89.79 and scaling points at the ABCD extension targets of 93.27 and 90.53.
Until price breaks the initial levels of 95.77 or 95.30, the probability is stalling vs bouncing at this juncture.
