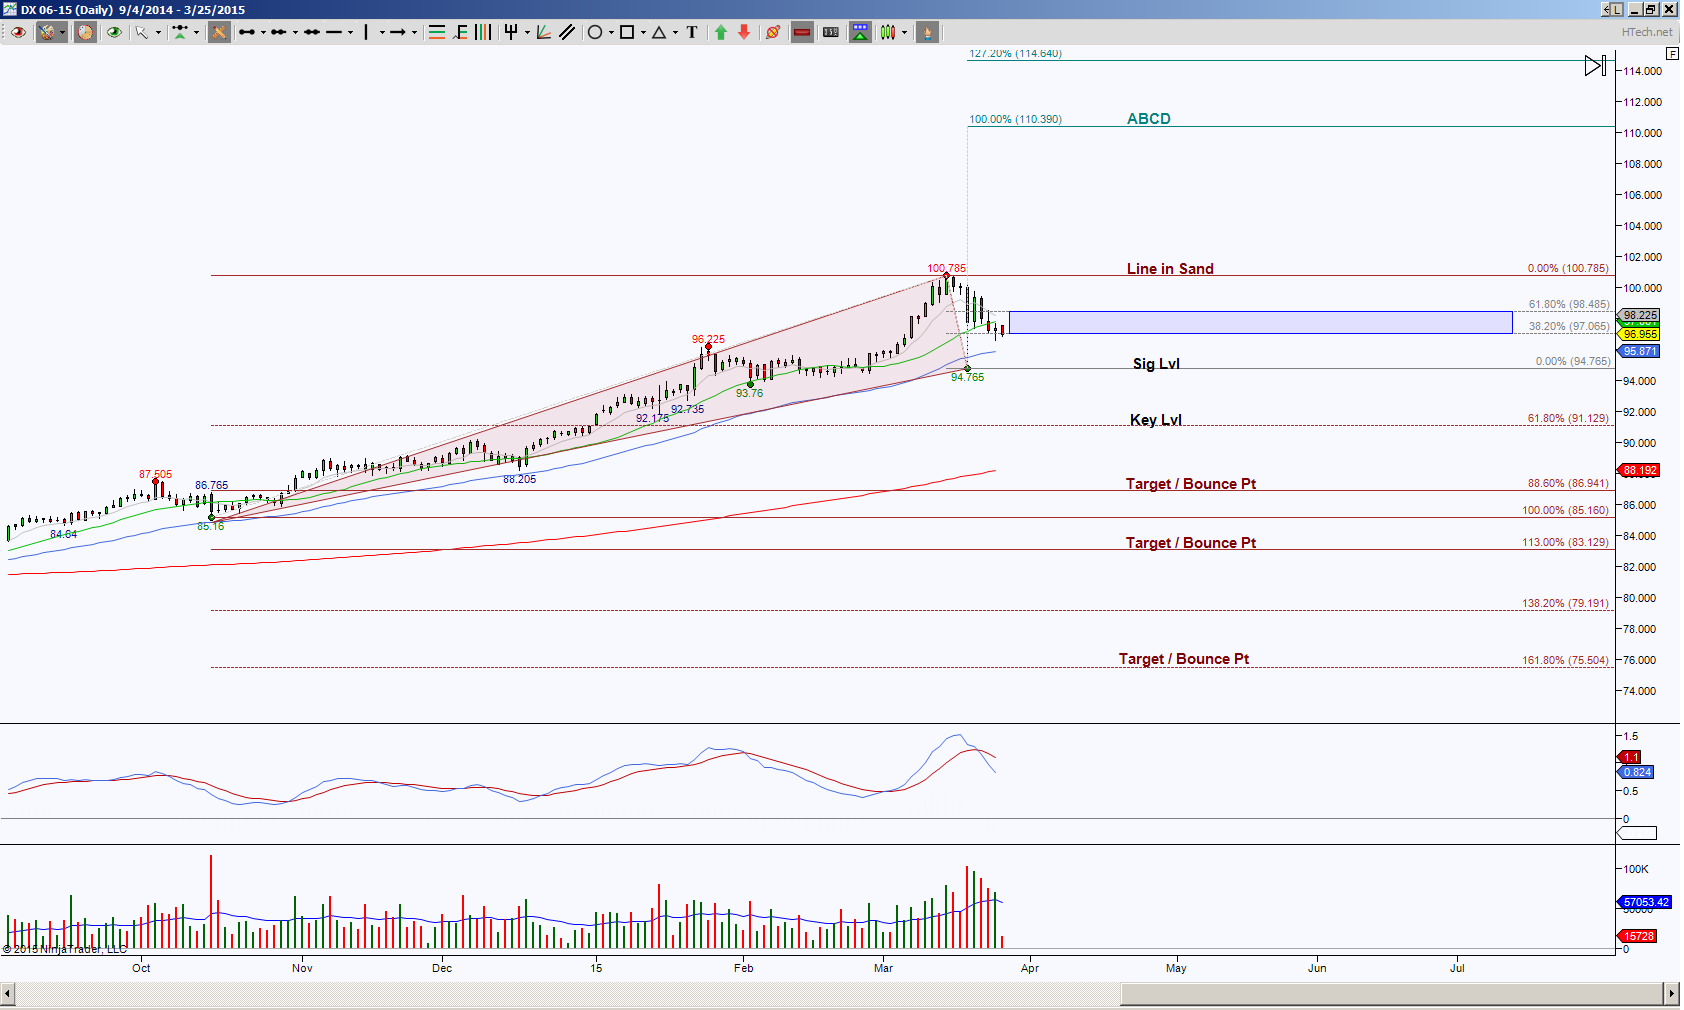
The US Dollar has multiple harmonic patterns, called a Bat, emerging on multiple perspectives. The Day chart view as shown on above chart shows initial levels to break and hold at either 98.485 or 97.065, price is currently breaching below the 97.065 and the longer it can hold below there, the higher the probability of retesting 94.765.
There are two do or die levels for opposing emerging patterns, the first at 100.785, the other at 94.765. Breaking one of these levels eliminates the other so these will be the next important levels to break and hold. An upside break of 100.785 increases the probability of testing ABCD targets 110.390, 114.640 and 120.046. A downside break has the ideal targets of 86.941 and 75.504 but there are intermediate levels that offer bounce or reversal opportunities at 91.129, 85.160 and 83.129.
Simply put, price is in a sideways range with neutral to downside bias until the dollar can break and hold beyond the levels afore mentioned.
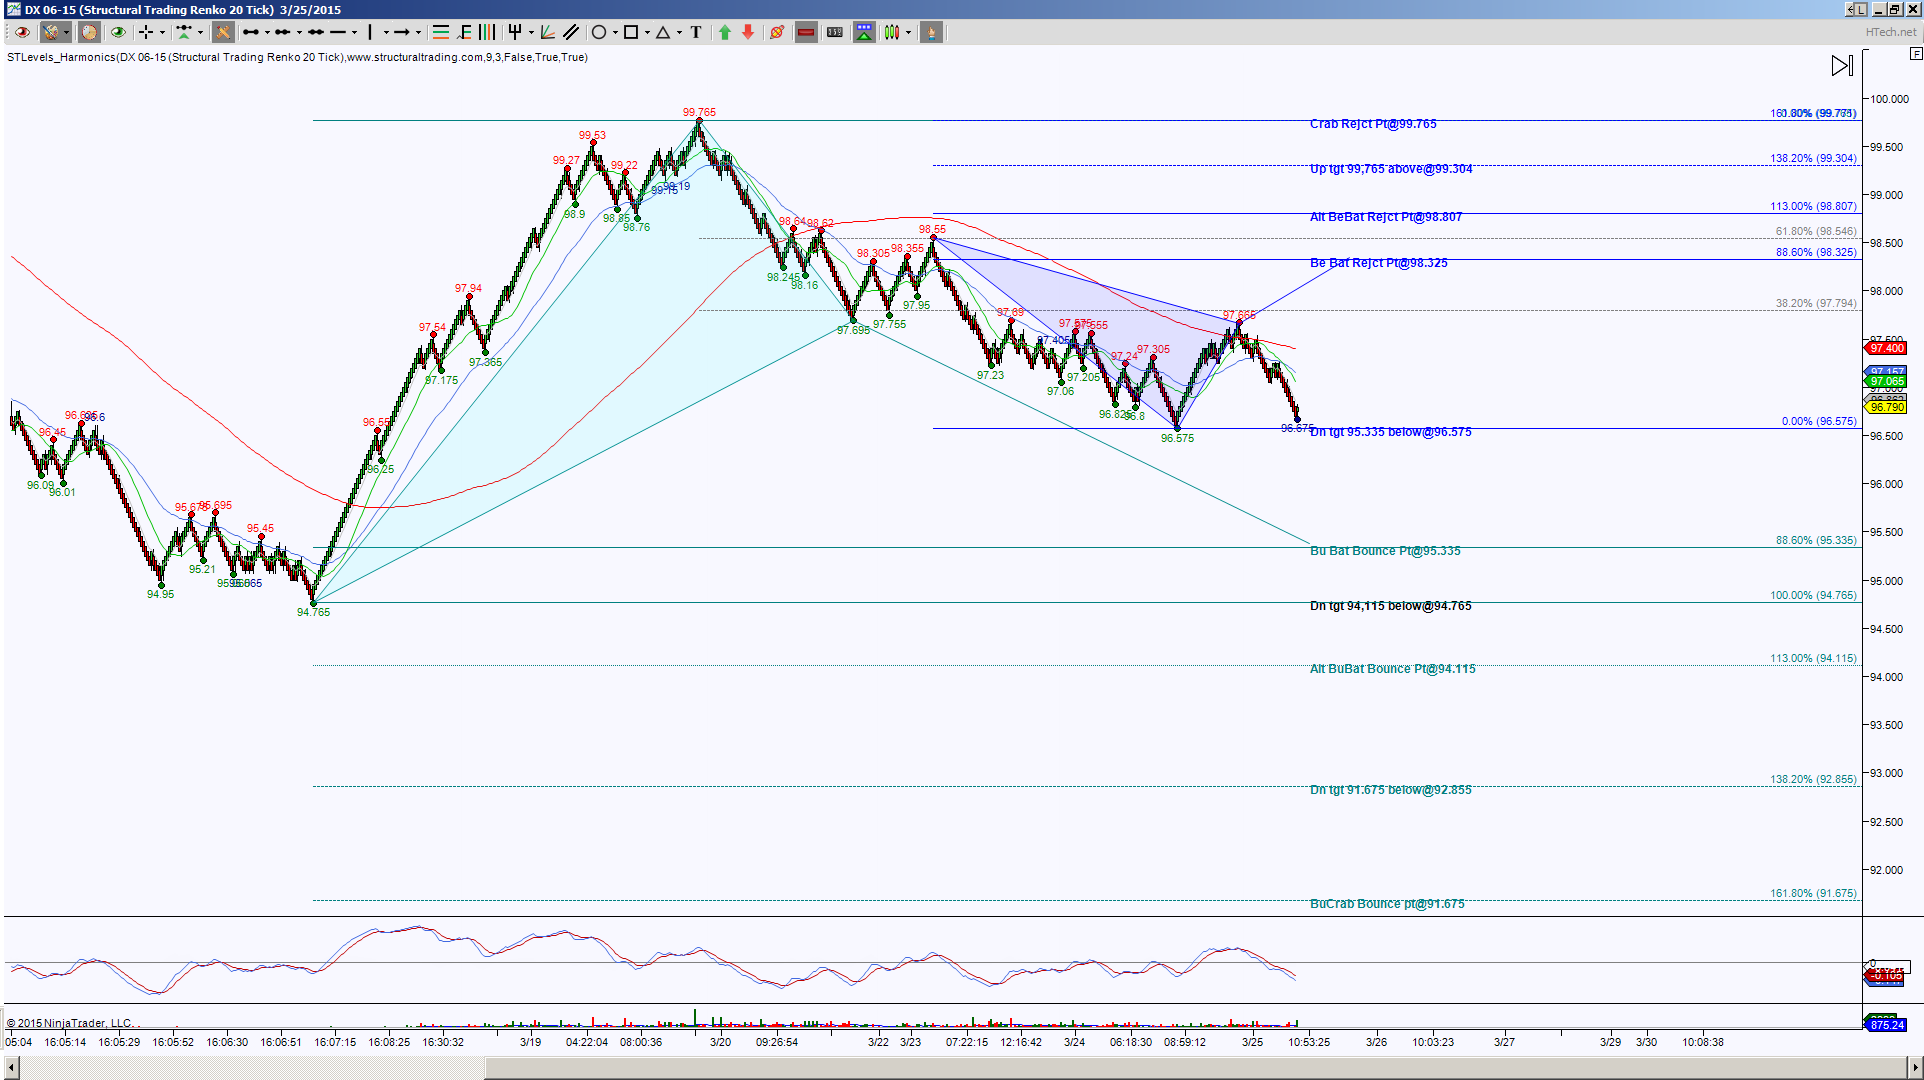
An intraday perspective, in this case I ‘m using an STRenko 20 bar chart, price is in between at least two Bats and there is a distinct intraday downside bias. The do or die level for the blue colored Bat is 96.575, below there wipes it off my chart, and the focus is completing the larger opposing Bat that is cyan in color.
The cyan colored bat has ideal targets 95.335 and 91.675, but there are levels listed on the chart that offer high probability bounce points, so look at it this way, each level I consider worthy of putting on the chart, I’ll be observing that level as either a scaling out point or potential reversal point.
I’m always wanting to have a plan should the other side of the silver dollar be flipped. Remember the 96.575 is a very important level, do or die for the blue Bat? Well as long as that level can hold as support the possibility of testing 98.325 or a retest of the double top at 99.765 remain in play.
Trading involves substantial risk and is not suitable for all investors. Past performance is not indicative of future results.


