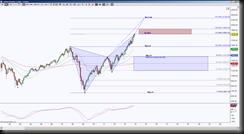
 The monthly SPX shows price is currently testing a Harmonic Pattern, Bearish Butterfly, PRZ (Potential Reversal Zone aka the completion target for a Harmonic Pattern), this last leg to complete the pattern began October 2011 and just now tagging the PRZ, so has taken two years to complete this pattern. Does this have more significance than an hourly Harmonic Pattern completion? In one sense, absolutely! In another sense, sometimes it’s that small timeframe Harmonic Pattern reversal that initiates the reversal on the larger timeframes. That’s one of the reasons I love Harmonic Patterns, they are fractal due to Fibonacci values.
But I divert, back to the monthly PRZ scenario, a hold below the red PRZ level 1823.75 implies an attempt to retrace this bearish pattern. This is a good time to remind you that bearish patterns are bullish in movement until they complete, and strong reversal Harmonic Patterns get a kick out of retracing 100% or more. But on a monthly perspective, this could take quite some time. So the initial downside target is 1576.09, followed by the ideal minimum retracement target 1381.79. Once price can test these targets, we can gain an directional interpretation based on how price behaves there.
Currently on this monthly chart, everything is saying hee haw to the upside. Excuse my southern roots coming through, I love holidays and the childlike nature it brings out in me. So, let’s take a look at a smaller timeframe to gain a zoomed in look at price behavior at this important resistance test. Going from a month chart to a 5 minute chart offers minimal to no help for gaining perspective, so it’s a good idea to keep perspective in timeframes. I could view a weekly chart, but since I typically use a daily chart for weekly views, that’s where I’m going. I’ll take this opportunity to state trading is a very personal endeavor, so if you prefer to look at a weekly or a 4 hour chart, that is encouraged but my typical bigger picture view comes from a daily chart so that’s my choice.
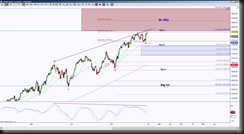
On this day chart, I’ve put the monthly red PRZ along with the noted Bearish butterfly and Significant level in large font, this helps remind me that it is the larger scenario effect. The monthly chart had correlation in momentum and higher prices, but the daily chart is showing divergence, meaning price has been making higher highs but momentum has been making lower highs. Since momentum typically precedes price, although this is not to be interpreted as an immediate development, it does increase the probability of an attempt to retrace the monthly Harmonic Pattern around here.
Another caution flag I see at this PRZ is price has formed an inverse triangle, or megaphone, this is still considered a consolidation formation, and it is typical that when this pattern forms at the top of a move, it is stating a shift in previous movement. Now the thing about megaphones is that it can make higher highs and remain within the red trendlines, so depending on the aggressive or conservative nature of a trader, has different trading entries. Since I prefer a more conservative approach, I’ll wait for a hold below 1823.75 region and price action clues before jumping in a short position for the retracement scenario. An aggressive short would have to risk beyond the upper red trendline.
The ideal Butterfly PRZ is at 1823.75, however as high as 1923.44 falls within the extended PRZ, so keep that in mind as well.
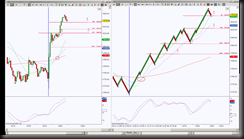
If you’re a newer trader and have not understood the gist of price action that becomes second nature to traders who have observed price behavior for tens of thousands of hours, then I would suggest going to one timeframe lower, for me that would be an hour chart if I were to use minute charts or I prefer STRenko Bars, in this case, I’ll look at 150 STRenko bars. This is done to see what is going on inside the daily candles during the day. I’ve placed the two charts side by side.
 The vertical blue line shows the same low on both charts. The left chart is an hour chart, and it shows that price is very high off moving averages, this is an implication of stall or pullback to them to validate the bullish cross. The red dot at the high is an implication that the upside move has completed and time for a pullback, and the momentum indicator is still bullish but shifting in that the blue line is flat vs upward slope.
The right chart is the 150 STRenko bar chart, this is a Renko Bar that was created for me, but there are standard Renko Bars available on most platforms. The upside red dot also implies the upside move is complete and time for a pullback, price is already testing the green moving average as the initial validation test of the bullish cross, but there is also a downside cyan dot which implies the downside move is currently being formed, and also the momentum indicator has already shifted from upside to downside bias.
Both charts show a hold below 1818.5 has a short opportunity to the initial target of 1810 to 1811, but more important, a hold below 1818.5 also implies price is attempting to move away from the monthly PRZ and toward the megaphone support on the daily. So price action states a hold below 1818.5 is a probability of downside move. It also states a hold above 1818.5 implies price could ride the daily red resistance trendline to higher targets so not a high probability of a good shorting place. Let me add, a hold above 1823.75 suggests an attempt to test all levels in the PRZ.

