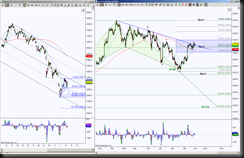
CL_F reached the 100% target for an Inverse Head & Shoulders pattern at 108.33
This correlates with two other daily Harmonic Patterns with completion targets right there with the H&S 100% target.
The initial test on 7/19/13 retraced to 102.71, a far cry from retracing to the ideal minimum retrace targets of 100.14 for blue Bearish Crab or 98.13 for the green Bearish Gartley. The second test of the PRZ 108.82 region had another opportunity for retracement mode but only breached the 102.71 before holding back above this level, keeping price in a sideways range.
So this sideways range between 108.82 and 102.71 becomes important support and resistance levels. A completion target enforced by two harmonic patterns’ PRZ (Potential Reversal Zone aka Harmonic Pattern completion target) makes a statement if fails to have a minimum retracement target hit or fails to hold price down. This is a statement of bulls regaining the reigns and has upside target for a double top at 115.11 with a scaling point at the H&S 127.2% target.
A breakdown of the support level 102.71 … due to false breakdown previously – not a bad idea for a close below this level and resistance test that holds to offer a high probability short opportunity … has the initial targets at the ideal minimum retracement targets. Since strong reversal Harmonic Patterns like to retrace 100% or more, it’ll be important if price can retrace more than the minimum targets. Notice the brown emerging Bat has correlation of 50% of Bearish Gartley & 61.8% of Bearish Crab so this will be a big support test if price makes it there.
************************************************************************************************************
On July 29, 2013, analysis was posted regarding Gold Futures, click here for that post. Let’s have a look for update on that analysis.
Current chart:

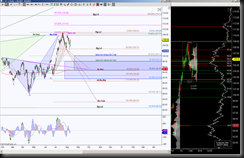
The original 7/29 chart showed price was approaching the midline on daily pitchfork and intraday chart showed price was in consolidation while in between opposing emerging patterns.
Keep in mind, since the July chart, the contract month has changed to Dec from Aug.
So once price held below the triangle and below the 1308.3 Dec contract, it invalidated the opposing blue Butterfly and completed the green Bullish Bat. This Bat is currently in retracement mode stalling around the 50% retracement level.
Intraday chart shows price is attempting to hold above the trendline, if so initial resist test is 1319.8, above there has gray fib targets to 1349.40 … this will take price above the daily pitchfork midline.
Intraday chart shows a hold below the blue trendline has 1301.4 as initial support test, below there has ideal target 1216.2, if price gets there, there is a potential breach of this PRZ (Potential Reversal Zone) to complete the daily blue Bullish Bat at 1204.4. There are scaling points along the way at 1290, 1276.5, 1267.1 and 1235.7.


