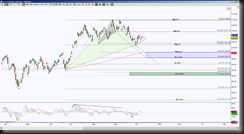
Can oil futures, CLX13, break it’s 3 month range? The Day chart showd price has recently tested 101, the lower region of the sideways range. So what is the probability that price will stay inside the range, I’m not a percentage type analyst, I base my bias more on where price is in comparison to important levels.
Look at the Day chart
Price is in a large sideways range between 109.9 and 101.03. Here’s where a small emerging harmonic pattern (purple Bullish Crab) offers a level that’s a bit closer, the 105.73 level. So now I see as long as price holds between 105.73 and 101.56, there’s neutral bias, but a break and hold (emphasis on “and hold”) of one of these levels increases the probability of which Significant Level is sought. Not only is price in between fibonacci levels determined by harmonic patterns, there’s also a small consolidation that’s triangular in shape, thus offering break and hold levels even closer together.
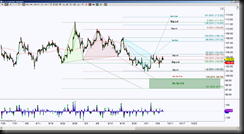
Now let’s look at the intraday chart (hour)
Opposing emerging harmonic patterns concur the rangebound scenario, but offers even more condensed important levels to break and hold. These harmonic patterns, differentiated by their own colors (triangles, titles, and fibs of same color are one pattern) tell a story.
A hold above 104.60 lessens the probability of completing the double bullish Deep Crabs at the 99.38 to 97.30 PRZ (Potential Reversal Zone aka harmonic pattern completion targets) and increases the probability of an attempt to complete the cyan Bearish Bat with the PRZ target at 107.33.
If price holds below 102.69, the initial important support test is 101.05, this means this is a definite place to take or protect a profit, a breach of this level invalidates the cyan Bat and has the large green PRZ as next downside targets.


