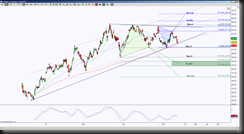
After viewing the financial sector, refer to the XLF post, I decided to look at a couple of stocks inside that sector. Remember XLF is in a consolidation after completing a large bearish Harmonic pattern. First let’s look at Citibank
Citibank is also in an Ascending Triangle while in between opposing emerging patterns and inside an uptrend Pitchfork channel. Currently price is testing confluence support at 48.74, the confluence derived from the triangle support line and the pitchfork support line coupled with the daily 200 moving average. Because 47.60 is an important support level harmonically, there’s a potential breach of this confluence support to test that 47.60 level, this is a line in the sand.
Below 47.60 has the ideal target of 39.97 and scaling points at 45.06, 43.99 and 42.82. A hold above 47.60 keeps price not only in the triangle but also in a sideways range as well, the initial important resistance test target is 51.75, above there has the confluence test of the triangle line and the Significant Level 52.88 or 53.30, above there has ideal target at 56.14 with scaling point at 54.32. Depending on the strength and swiftness of the breakout of 53.30, the bearish Crab PRZ could correlate with the top of the pitchfork.
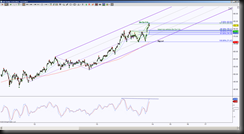
Now let’s look at AXP, another financial sector stock.
American Express is also in an uptrend pitchfork channel. It has just recently completed a harmonic pattern, Bearish Deep Crab, that correlates with the Pitchfork 3/4 line and remember this also correlates with the completion of the XLF very large harmonic bearish pattern.
The ideal retracement target for the Bearish Deep Crab is 79.11, this currently correlates with the Pitchfork midline and the rising 20 moving average. This all says that a pullback to 79.11 is an important support test, a hold above there keeps an upside bias, a hold below there implies continuation of the retracement mode and has the ideal target at 71.47 or the Pitchfork support line.
So what’s the purpose of comparing a couple of the stocks inside the Financial sector? The “group” of stocks in this sector is currently indecisive as shown in the consolidation. Which is first, the egg or the chicken? Will the individual stocks push the sector or will the conglomerate in XLF push the individual stocks? Regardless, if you see confluence between XLF and a stock in that sector, it increases the probability of directional bias. Keep in mind, it is highly recommended to trade the chart of the instrument you trade, but it is also a good ideal to find confluence or divergence between a stock and it’s sector.


