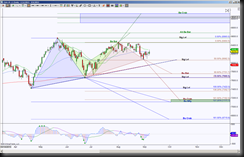
DAX_F, the Futures contract of the German index of stocks, has been busy forming multiple and opposing harmonic pattern rotations, of course this is typical when price is in a sideways range. Extreme regions of the range are 8565 and 7422, these are important levels in that if price can close beyond one of the levels and push off of it in an impulsive motion, since profound breaks of a range offers an expansive reciprocal movement, there are distinct targets that harmonic patterns offer traders.
What’s the purpose of observing this DAX_F market? There can be correlation with US market movement and is often a leading indicator. Be cautious though about trading one instrument based off the price action of another, trading decisions should always be determined by the instrument being traded.
There is an upside to being aware of other markets, both DAX_F and ES_F are in sideways range movement. There’s no 100% guarantee to know when a break of consolidation will occur, but if DAX_F breaks to the upside of a long time sideways motion, I would tend to be a bit more cautious about stalking a short position in ES_F. It doesn’t mean I wouldn’t take a short position if the setup occurs, I’m just saying …
Looking at the daily perspective on the chart, there’s many lines … many targets … and many significant levels, but in labeling these I gain a perspective I otherwise might have missed. For instance, typically I look at a 50 DMA (daily moving average) for the line in the sand for directional bias … my 50 DMA is blue and Friday, price closed above it and the previous eight days were closes below it, this has a slight upside bias … but you always have to be cautious using this clue when the DMA is flat (going sideways). Another little clue is there’s a blue uptrend dashed line, as long as price holds above that, the bias is to the upside. And the Harmonic clue is 8062.3 Fibonacci is a double B point (if that doesn’t make sense, just know it’s an important harmonic level) and as long as price holds above it, the ideal scenario is a retest of 8464.50.
So if 8062.3 Fibonacci ratio and the blue uptrend line are the gauge for upside bias, doesn’t it make sense that if price closes below them and holds below them that the probability of bias shift to the downside occurs?
Here’s the trading strategy for these Harmonic Patter rotations. If price holds above 8464.50, this offers a long opportunity to the ideal target of 9124 and scaling points (remember scaling points are areas to take profits, protect profits or stalk an opposite position because they have a probability of being a rejection point) at 8565, 8683 and 8911. If price holds below 8062 and the uptrend line, this offers a short opportunity to the ideal target of a double bullish PRZ (double meaning two separate rotations have a similar completion target, PRZ means Potential Reversal Zone) at 7163, and scaling points at 7752, 7660 and 7422.
*******************************************************************************************************
SPY – What a great example of a strong retracement of a Bullish Bat Harmonic Pattern, retracing over 100% to complete a Bearish AB=CD.
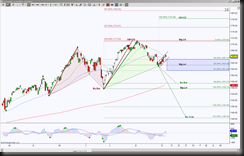
Look at the daily chart of SPY, the brown triangles show the completion of a harmonic pattern, called Bullish Bat. The candle formation offered clues to either a stall or attempt to retrace at that 155.73 level … well, as you can see, price went above the highest point of the brown Bullish Bat … over 100% return from that 155.73 PRZ (Potential Reversal Zone aka Harmonic Pattern completion target).
Is it any wonder these Patterns are called Harmonic? The completion of that ABCD is what helped that nice retracement of the Bullish Bat. AB=CD is a simple Harmonic Pattern rotation where there is an impulsive move, in this case from the 153.55 low to the 169.07 high, followed by a pullback (thanks to the completion of that Bullish Bat), then the completion of the AB=CD is derived from a continuation of the initial impulsive move, with symmetrical range and slope (ideally).
Moving on in the Harmonic Pattern World, using the SPY chart as it’s playground, the completion of the AB=CD created a new impulsive move to the upside, from the 155.73 low to the 170.95 high, followed by a pullback … uh notice another symmetrical scenario? This pullback is the initial formation of another Bullish Bat Harmonic Pattern! You have got to admit … that is pretty awesome … these patterns always keep me in awe.
So currently price is in a bear flag formation (this is consolidation in the shape of a small channel that goes in the opposite direction of the most recent directional move as shown with the red dashed channel lines), so a breakdown of the channel and a hold below there has retracement targets as shown by the green Fibonacci ratios -(caution of fake breakdowns – where price breaches below the channel but pushes back inside the channel rather than continuing in the direction of the breakdown). The completion of the Bat helps the AB=CD retrace 88.6%, the completion of the Bullish Crab at 146.32 helps the retrace 161.8%.
Within the action of the bear flag, price is also forming the third leg of a four legged pattern, and has 170.95 as the very maximum price can go and keep that green Harmonic Pattern in play. Simply put, there’s a slight upside bias to form this leg, once the leg is complete, the final leg creates downside bias seeking the Harmonic Pattern PRZ as the ideal target, but also having scaling points along the way as shown in the green Fibonacci’s.
What happens if price does hold above the 170.95 level, by way of either invalidating the emerging green Bullish Bat or a retracement of the completed Bullish Bat? Well, the ideal target is another AB=CD PRZ at 178.29, and there’s a scaling point along the way too, it’s the previous AB=CD extension target at 175.47.


