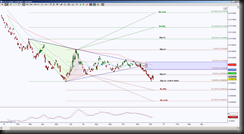
Japanese Yen futures approaching a line in the sand level for opposing emerging Harmonic Patterns at 0.009650
 There was a recent break down of a triangular contraction formation and the bias has been to the downside since however it’s a good idea to respect a line in the sand level because it is a do or die situation for a scenario to play out.
Since the current bias is bearish, a hold above 0.009650, I would think of a hold as a bounce into resistance until price can hold above important regions to suggest a reversal. The initial resistance test target is 0.009863, a hold above there has a GRZ target (GRZ= Golden Ratio Zone) at 0.010030, a hold above this region would suggest a probable change in bias to the upside and offers a conservative long opportunity to the ideal targets 0.011354 or 0.011818 to complete the green harmonic patterns and scaling points (also considered potential rejection points) at 0.010646 and 0.010990.
If price breaches below the line in the sand level 0.009650, the green patterns are invalidated and I remove them completely from my chart. A hold below there has the opposing emerging brown patterns increasing in probability of playing out, so offers a short opportunity to the ideal target 0.009034 and scaling points at 0.009379 and 0.009270.
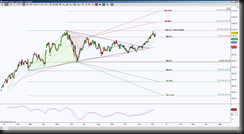
 The currency $USD/JPY will look like the 6J_F chart only upside down, so the upside line in the sand level that price is approaching is 103.73.
