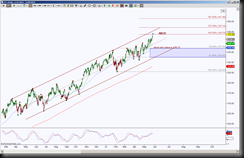
IYT is the ETF symbol for the Dow Jones Transportation Average. This has been in an uptrend channel since April 2013 and currently testing a harmonic pattern’s target of 143.75 as attempts to retest the channel resistance line. Trending channels offer guidelines as to strength of a bias, in this case to the upside, as well as pull back targets and important support test targets.
 The day chart clearly shows the uptrend channel and its midpoint, the longer price holds above the midpoint, the stronger the inclination is for upside bias. The ABCD harmonic pattern target is 143.75, this is a symmetrical move target and this level becomes a line in the sand region, a hold below it implying an attempt to go into retracement mode and the ideal minimum retracement target is currently at 137.03. Harmonic patterns strive to retrace 100% but until price can break below 132.62, that probability remains low. The initial support test for a pullback is the midpoint of the channel, if price approaches this area, there’s a potential breach to test the GRZ level 137.03.
Failure to come back to the channel midpoint keeps the upside bias strong and has the ABCD extension fibs 147.14 and 151.46 as the next upside targets. However this chart has some negative divergence with momentum, as well as signs of extension, so this implies either a stall or pull back. This is typical of expansion moves needing a rest or balance period between buyers and sellers. Markets, stocks and all instruments move in cycles of expansion and contraction. A stall is a sign of contraction, like holding your breath, which can only be held, or in contraction mode, for so long. The same goes for expansion, likened to exhaling, which can only breath out until there’s no more air.
This particular instrument has a gap up to a potential reversal point, so I’ll watch for a stall or pull back. Pull backs are considered just that until price can take out important support, then it’s deemed more of a reversal type scenario. So, I consider rejection points as pull backs until proven otherwise.
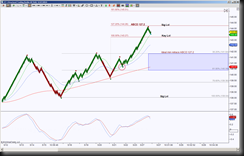
 If you’ve been following my method of analysis, then you know I like to take the timeframe or bar size to an intraday perspective to get a better look at what’s going on at key levels. In this case I’m using an STRenko 20 Bar size and I find it interesting that an ABCD pattern is in play on this smaller view. Remember the daily gap up, the anticipation of at least an attempt to pull back? Well this chart shows momentum trying to pull price down into support, and the first agenda for a support test is to validate a bullish cross, this is merely a crossing of a faster moving average above a slower moving average, and sloping with conviction to give an upside bias. Initial pull backs are targeted at these moving averages to either validate or invalidate that bullish cross. So the first test is at 143.45, this helps price return to a level that was a break through point, the AB=CD symmetrical movement target of 143.27, the last chance to validate the cross is currently at 142.58, this will help price have a fighting chance to reach the ideal minimum retracement target of 141.84.
Now, there’s the thing, if price invalidates the bullish cross, meaning it pushes below the 142.58, this increases the probability of testing 141.84, and this increases the probability of testing the midpoint of the channel on the daily chart. But if price holds above that green moving average and the 143.27 level, then the probability increases to stall in a sideways range until price can either go above 144.26 or below 143.27 and hold beyond these levels. Holding and breaching are two separate entities, a breach is more of an emotional or stop run type of scenario, whereas a hold changes a support level, for instance, into a resistance level.
So both the longer term and intraday charts have upside bias, watch for the intraday perspective to either hold its support or invalidate a bullish bias first, then that will at least imply on the day chart that the midline has a probability of being tested rather than be in a stall or sideways motion.
