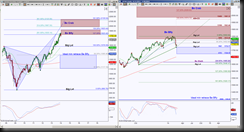
Will the daily Harmonic Patterns help the monthly Harmonic Pattern play out? A previous SPX post described how the monthly chart of SPX was testing a bearish Butterfly PRZ (Potential Reversal Zone aka a harmonic pattern’s completion target zone). That particular posted chart had the monthly and hourly chart comparison. This time let’s look at the monthly and daily chart comparison
 The left chart shows the monthly scenario, the Bearish Butterfly pattern’s PRZ being tested, the ideal minimum retracement target at 1395.46. Keep in mind that the Bearish Butterfly began it’s final leg in 2011 and here we are in 2014, so it could take a while to reach the ideal minimum retracement target.
The right chart is the daily chart and it shows price at an interesting juncture because it’s in between opposing emerging patterns. The outcome of one of these opposing patterns completing will help determine the probability of retracement mode of the monthly Bearish Butterfly, or attempt to test all levels in the the PRZ or even seek the levels of the extended PRZ for the Bearish Crab.
The monthly zones and ideal minimum retracement target is visual on the day chart. The current perspective is there was an impulsive move beginning in October 2013 that tested the PRZ for the Bearish Butterfly and has rejected it, BUT so far has a shallow retracement that impulsive move.
Within this shallow retracement, harmonic pattern traders are gifted with opposing scenarios, line in the sand levels and targets regardless of directional movement.
But back to what the day chart is describing in harmonic terminology. There’s an emerging triangle (shown in dashed green outline), if price can bounce up to at least 1802.66 but no more than 1850.84, the probability of the 1665.28 PRZ increases, A push through the 1850.84 significant level, the probability of all levels inside the monthly Butterfly PRZ increases and invalidation of the green pattern scenario.
Let’s say price has enough of a bounce to form the 3rd of 4 legs for the green pattern and begins it’s final leg which would have a downside movement to the completion target of 1665.28. This scenario does a couple of things, it has a larger pullback than previous pullbacks since May 2011 and it helps price get going into the direction needed to test the ideal minimum retracement target. Now a retracement to 1395.48 is huge in intraday perspective, but on a monthly perspective, that is a shallow retracement and would be an important level to be watching.
Since I always like to be prepared for any scenario, if price pushes through the 1850.84 Line in the Sand level, then this implies more upside in store before another attempt to go into retracement mode. Notice that an AB=CD target of 1974.72 will help price test the extended PRZ, this increases the magnetism of that region should price hold first above 1850.84, and second above 1923.44.
It’s said that momentum precedes price, well there was negative momentum divergence when the 1813.55 high moved up to a new high of 1849.44, this was followed by another negative momentum divergence when the 1849.44 price was exceeded to a new high of 1850.84. I’ve noted the momentum direction with red trendlines. And indeed the current pullback followed that negative momentum. There’s no way of knowing if this is all we get to the downside until price can hold below 1772.77, but it was a good preview of price action, wouldn’t you agree?
So on a bounce, important resistance levels are 1802.66, 1832..42 and 1850.84. And important support levels are 1772.77, 1724.51 and 1665.28.
