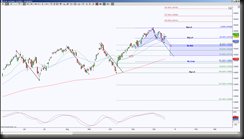
Dow Jones E-mini Futures has been in an uptrend and at an interesting point of interest while in decision mode of what will play out.
 There are harmonic and symmetrical movements that have a downside pull to 15170. The previous three pullbacks were symmetrical in nature, if the symmetry continues, the target is shown by the fourth dashed black trendline. This correlates with a support fib of a GRZ (Golden Ratio Zone).
Currently there’s a small emerging Harmonic Pattern, a bullish Bat and Crab that their completion will help price test the symmetrical target as well as determine weakness or strength in this current pullback.
Price is stalling with an indecisive nature at the significant level 15753, so this is the line in the sand, meaning a hold above this level implies upside bias with an important resistance test target at 16106 and scaling point at 15892. A hold above 16106 would invalidate the emerging blue pattern and disrupt the symmetrical cycle.
A hold below the line in the sand level 15753 increases the probability of the blue pattern playing out. There is some confluence at the completion of the Bullish Bat (bullish Harmonic Patterns have bearish move until the completion of the pattern, then a valid reversal pattern becomes bullish bias) at 15480, because a larger impulsive move from 14592 to 16106 requires a retracement to at least 15528 for a new Harmonic Rotation.
A break down of 15170 to complete the blue Bullish Crab also changes the symmetry of previous pull backs, and also implies more sellers are stepping in.
