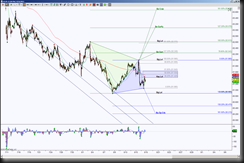
Last month I was looking how price was holding inside the Pitchfork extremes, click here for that post. The month of August price broke and held above the pitchfork and has begun stalling between 82.610 and 80.895. Within this range, price has formed opposing emerging patterns.
The initial important resistance test is a small GRZ (Golden Ratio Zone) 81.420 and initial important support test is 81.065. Above 81.420 has ideal intermediate target at 82.243 with scaling points at 81.530, 81.640, 81.889 & 81.995.
Below 81.065, initial support target is 80.895, below there invalidates the green Gartley and has ideal target at 80.215 with scaling point 80.475.
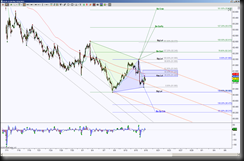
What about the pitchfork … still in play? Well, you could leave it on your chart but I’d rather draw a new one, because price is currently moving away from the first one, I want to see where price would need to break to change to upside bias or keep within the pitchfork with downside continuation and if there’s any correlation with the harmonic rotations.
The new coral pitchfork shows that the upper level correlates with the 81.889 target (depending on how swiftly price can get there) for a nice BC leg of blue emerging Deep Crab, and a hold below that pitchfork resistance offers higher probability of testing the pitchfork midline which correlates with the B point at 81.065. Sound like jibberish? The important thing is if there is confluence using the pitchfork lines and the fib ratio’s, and there are. Notice also the lower pitchfork line has correlation with the completion of the Bullish Deep Crab.
Also notice the slope of the new pitchfork … it’s not as steep to the downside as the first one, so this could be interpreted as the momentum to the downside is waning. Also the range of the new pitchfork is wider than the steep one, this means the most recent upside swings have been higher and a hold above the resistance line implies momentum shift.


