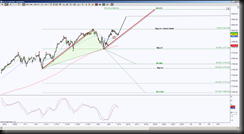
 An hour chart offers a nice intraday perspective because it offers levels on a large enough spectrum but not too large to prevent price from reaching them.
ES toyed with a Line in the Sand level 1812.50 but currently remains uncommitted for directional bias concerning this level. It is considered a Line in the Sand because it is the do or die level for opposing emerging harmonic patterns.
A hold below 1812.50 implies an attempt to test the 1777.50 downside target, this is the initial important level to test in the green harmonic pattern that has completion targets to the downside.
There are a few regions to contend with along the way, namely the moving averages, in this case the 20 sma and 50 ema that recently formed a bullish cross. After a bullish cross, pullbacks to them offer a visual validation of that bullish scenario. Currently price is failing the initial test of the 20 because price is holding below it. I consider the 50 as the last chance Charlie for the validation of the cross and so far it is holding as support. Once price holds below it, the probability increases to test 1777.50.
I always like to have the opposite scenario since I am not in charge of the markets and I only have probabilities on my side, this way I’m prepared mentally, emotionally and analytically no matter which direction price goes. With that said, if price starts to hold back above the 20, the probability increases to retest that Line in the Sand 1812.50. A hold above there has an AB=CD target of 1848. An ABCD is a symmetrical measured move. (Notice there is a smaller measured move that offers a scaling point towards the 1848 target.)
So most important is where is price in relation to 1812.50, then the other factors become the moment’s bias with determined targets.
