 Using multiple timeframes for instruments can help keep a trader in a trade and offer clues to tighten position or prepare to exit.
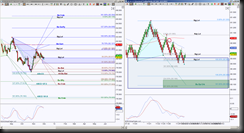
The left side of the Dollar index chart is the daily perspective, it shows price is testing a GRZ (Golden Ratio Zone) level 80.617. The right side of the chart is the STRenko 20 bar chart, which is similar to an hour perspective. The GRZ on the daily chart is a blue rectangle, I’ve shown that particular GRZ on the STR20 (STRenko 20) chart. Now let’s break down some key components that offer clues.
First, if you use my STPesavento indicator (aka STP), it shows cyan dots to the downside, this is an implication that price is still forming a downside rotation on both timeframes, this is bearish bias.
Second, the STR20 chart clearly shows price currently holding above the day’s GRZ, but the red circle on the STR20 represents a bearish cross, and a hold above 80.700 (current position of the falling 20 sma (green moving average) implies a test of the blue moving average which is currently at 80.808 for a validation of that cross. If price cannot get there or tests it and holds below it, the bias remains bearish. If price holds above the falling 50 ema (blue moving average), that is an implication to protect a short position by either exiting or locking in profits with a stop unless you can withstand price moving up to 81.164.
Third, If price holds below 80.617 GRZ, there is an emerging Harmonic Pattern called a Bullish Deep Crab that has a completion target at 80.081. Notice how a completion of this pattern helps price test the bottom of the daily GRZ If price makes it here, this is a good place to take short position profits or stalk a long opportunity for a bounce and attempt to retrace that STR20’s Harmonic Pattern.
Important initial levels are 80.808 or 80.617, the reasons have been explained above. I hope it helps have a better understanding of using multiple timeframes.
