Gold Futures is testing both bigger picture important support and correlating intraday bullish PRZ
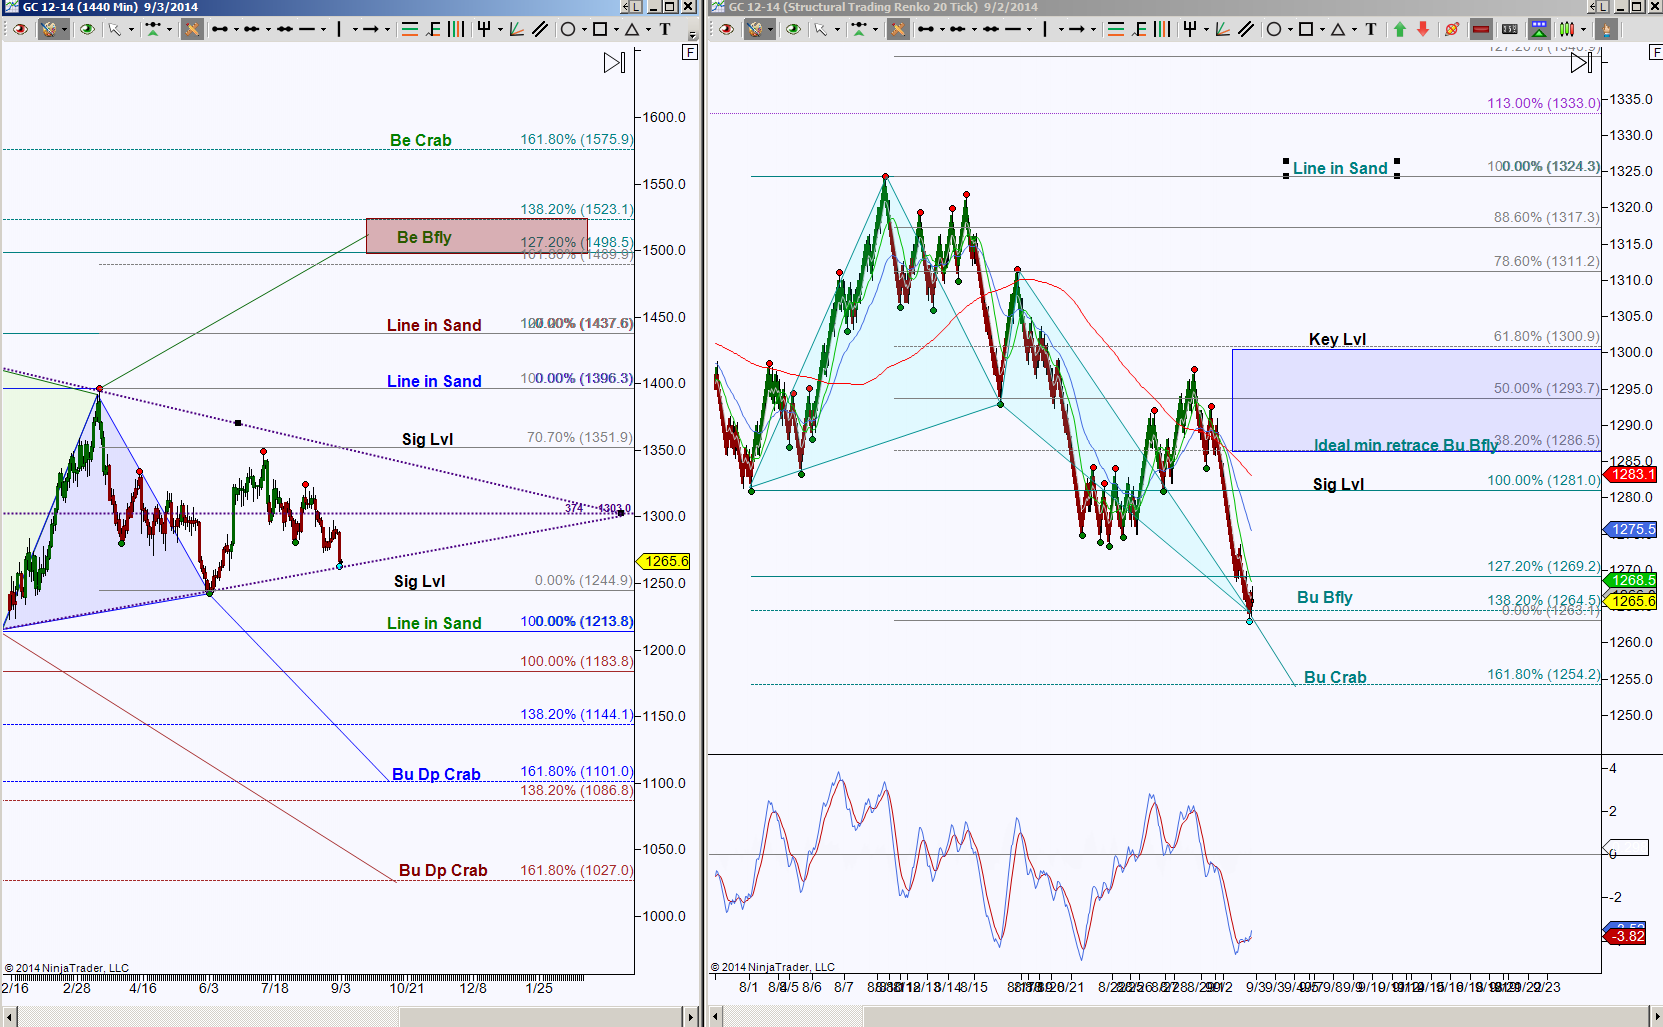
 The left chart shows daily bars and clearly shows price is testing the triangle support line, the right chart is an intraday perspective, in this case I’m using an STRenko 20 bar, is testing a bullish Butterfly PRZ. Both charts show there’s a potential breach to test nearby levels, namely 1254.2 to 1244.9. But the important thing is if price can hold above 1263.1, if so, the ideal minimum retracement target for the Butterfly harmonic pattern is 1286.5, and the midline for the daily triangle target is 3013, notice if price gets here, that Butterfly will have retraced over 61.8%.
If price has downside continuation, it’ll be important how price behaves first at 1254.2, then 1244.9 and 1213.8, below there invalidates an opposing emerging pattern and has the ideal target at confluence region of 1100 and scaling point at 1183.8 and 1144.1.
Keep in mind that this daily triangle began in June 2013 and that triangle breaks can be false or fake breakouts. There is a long opportunity here at the confluence support of 1264 ish with risk below the trendline, or if risk tolerance allows the risk below 1244.9, with the ideal target at the top of the triangle, and once there has a potential breach to test 1351. And a short opportunity with a break down of the triangle. However a conservative short approach is to wait for a closing day candle (or candles) below the triangle trendline, then a bounce into the trendline for a resistance test that holds, this scenario validates the breakdown.
