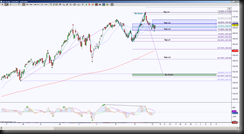
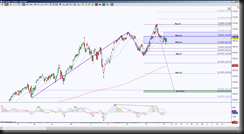
Since SPY is the ETF for the S&P Emini Futures, ES, it makes sense that the two charts correlate. I’ve used RTH (regular trading hours) for SPY … mainly because this instrument typically has globex spikes, that I personally find irritating when it comes to Harmonic Pattern rotations, and ETH (extended trading hours aka including globex session) for ES.
Let’s look at the ES chart first, there was a Harmonic Pattern Bearish Shark that completed at 1723.75 high, the ideal retracement initially is the 50% fib for a Bullish 5-0, this is a great setup for shallow retracements of patterns to offer an opportunity to enter a trade for continuation movement, in this case to the upside.
For me, I always like to be aware of the opposite scenario, it has been more beneficial in remaining fluid with market action by refraining from being married to a scenario, and being prepared for “what if that doesn’t work” possibility. So … what if the Bullish 5-0 fails to attract buyers and get a healthy retracement? Since 5-0’s typically like to retrace to the previous high (or low), failure to get there implies the Bearish Shark has continuation in its retracement mode and Sharks, like 5-0’s like to retrace 100% or more, so the ideal target for the Bearish Shark retracement is 1618.50.
Now let’s look at the SPY daily chart
As you can see, there was also a Bearish Shark that completed at 173.52, however, the 50% retracement for a potential Bullish 5-0 Harmonic Pattern is not as clear as on the ES chart, because on ES chart, it’s doing a good job holding above that 50% fib level, whereas SPY price is very indecisive regarding the 50% fib level which is a tad bit more bearish … which shall lead the other? We shall see.
The main thing to look for at this juncture in both instruments is where is price in regards to the larger GRZ? (GRZ means Golden Ratio Zone derived from the area between 38.2% and 61.8% fib ratios).
A hold above ES 1683.5 and SPY 169.52 has the ideal target at previous high with scaling points at the fib ratios listed on the charts.
A hold below ES 1658.75 and SPY 167 has their own large Bullish Shark PRZ at ideal target and scaling points at the listed fib ratios on the charts.
Keep in mind that these smaller Sharks and their respective 50% retracements is a fractal for larger Sharks … so if both ES and SPY complete their larger Bullish Shark Harmonic Pattern, you already know to draw a fib from the high to the Shark PRZ to find the 50% fib for the upside target.


