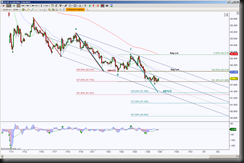
In a recent MrTopStep commentary about DX, click here, or for ST members, posted here first, I noted that price was testing a completion target for ABCD pattern at the 82.010 target. That particular ABCD pattern attempted to retrace, but failed to reach the minimum ideal target of 82.625, compliments of the Pitchfork resistance holding price down.
With the rejection of the Pitchfork resistance line, price formed a new ABCD pattern. This hour chart shows the completion target for the new ABCD has confluence with the Pitchfork support line AND the original ABCD 161.8% extension target at the 81.365 region. This behaves like a magnet and important support test if price gets there … so a definite place to take profits if already in a short position, protect profits if in a profitable short trade, or prepare to exit a short or enter a high probability long opportunity.
Currently price is holding between the original ABCD 127.2% (accompanied by the Pitchfork 1/4 line) and the Pitchfork midline, this is contraction mode and needs to break either above the midline or below the 81.698 level to target the extremes of the Pitchfork and / or complete the new ABCD.
**************************************************************************************************
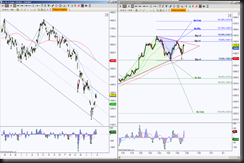
The left side of this chart is the Daily timeframe, this shows price rejected the top of the Pitchfork, tested each quarter segment to the bottom. A bounce from the Pitchfork support line is attempting to reach the midline for a resistance test. Notice how the daily 50 moving average is a stalling point, price is in contraction mode.
Switch to the hourly chart on the left side and contraction mode indeed! Price is in between two opposing emerging patterns, price is in a sideways range between 1348.7 and 1308.4, AND price is in a triangular consolidation inside the sideways range.
From an hourly perspective, price has been in an upside move and for the first time since the 1186 low, there’s been a lower high, add that price is in heavy consolidation raises a caution flag for upside bias. Of course if price takes out 1348.7 high, we want targets and the blue emerging Butterfly and Crab offer help to test the daily midline and possibly a breach of it. A hold above the Pitchfork midline implies a retest of the top with a scaling point at the 3/4 line.
So watch for the red triangle to break and hold first for the initial clue, then the 1348.7 or 1308.4 levels to break and hold, these valid breaks offer the higher probability scenario for the opposing targets.


