Click here for video on reading my charts.
When intraday levels or patterns are exceeded or invalidated or you want more detailed analysis, please refer to charts posted for the week, click here
I have minimal time today for updates, so I’m reposting some of the charts from yesterday with updated comments below, if applicable:
******************
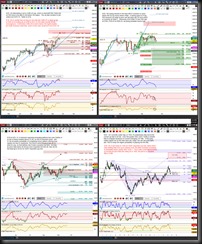
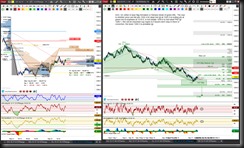
ES initial levels to break & hold are above 2506 or below 2486.25 from Day perspective, curently price is toying with lower region of STR20 Alt Bat PRZ, where price is in relation to 2494.5 is key. Bias is to upside unless initially breaks down 2486.25, then more important hlds back below 2486.25.
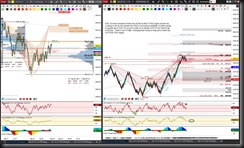
NQ is weaker than ES & if can hold below 5858.25, increases the probability of completing the green Day Bat at 5816.75. Intraday bias is to downside unless price can hold back above initially 5919.5 then more important above 5924.75.
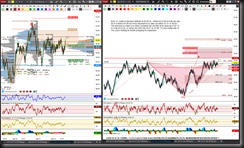
CL invalidated the Day cyan pattern, so primary focus is if price can hold above 53.03 for brown pattern completion.
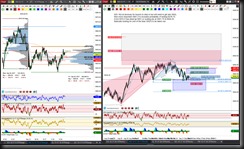
GC testing important resistance at 1315.2, above there increases the probability of testing Retrace targets 1325.3 to 1339.5. Otherwise a break down of 1302.4 increases the probability of testing 1286.1 or 1265.3.
Have a question about an instrument not listed? Just ask me.
Disclaimer:
Structural Trading is not an investment adviser, nor a securities broker. Information shared here is intended for educational purposes only.
All methods, techniques, indicators and setups shared by Structural Trading are not a guarantee of success or profit.
Futures and Forex trading contains substantial risk and is not for every investor. An investor could potentially lose all or more than the initial investment. Risk capital is money that can be lost without jeopardizing ones’ financial security or life style. Only risk capital should be used for trading and only those with sufficient risk capital should consider trading. Past performance is not necessarily indicative of future results.
Hypothetical performance results have many inherent limitations, some of which are described below.
No representation is being made that any account will or is likely to achieve profits or losses similar to those shown; in fact, there are frequently sharp differences between hypothetical performance results and the actual results subsequently achieved by any particular trading program. One of the limitations of hypothetical performance results is that they are generally prepared with the benefit of hindsight. In addition, hypothetical trading does not involve financial risk, and no hypothetical trading record can completely account for the impact of financial risk of actual trading. for example, the ability to withstand losses or to adhere to a particular trading program in spite of trading losses are material points which can also adversely affect actual trading results. There are numerous other factors related to the markets in general or to the implementation of any specific trading program which cannot be fully accounted for in the preparation of hypothetical performance results and all which can adversely affect trading results.
It is advised to NEVER follow a trade setup blindly, but rather always understand why a trade is entered and have risk management defined before entering a trade.
Structural Trading will never share or sell personal information of members.

