When intraday levels or patterns are exceeded or invalidated or you want more detailed analysis, please refer to charts posted for the week, click here
Futures Pattern Scanner by Neoharmonics:
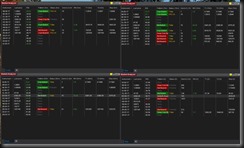
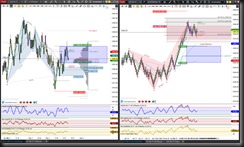
ES_F inside multiple zones & at value so this is just a description that price is in decision mode. Ideally want to see price brk & hld beyond STRg8 GRZ or STR20 PRZ. Looking at momo shows dnside pull but scenario is in PB Mode til proven otherwise, ie in Retrace Mode of STR20 bearish Crab.
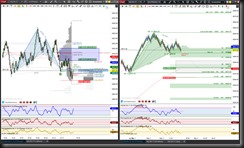
NQ_F completed STRg8 bullish Bat (lt blue) but had shallow retracement, currently price has returned to that PRZ & initial lls to brk & hold ar above 5611.75 or below 5607.5. However this brks on this smaller view helps the larger STR20 play out which is in emerging Bat (green) but currently stuck inside its GRZ so where can brk & hold outside of that offers higher probability directional tgts.
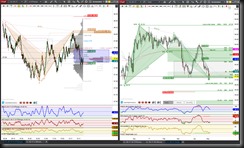
CL_F completed STRg8 bearish Bat & retraced over 61.8%, currently price is inside that GRZ so abv 47.76 or below 47.59 are initial lvls to brk & hold for initial directional tgts. Bigger Day chart shows price is at secondary test of Bat PRZ, for Retrace Mode bounce, want to see HSI hold above midpt & RSI Amp push above OS region, otherwise a dnside continuation has 46.1 & 44.78 as next tgts.
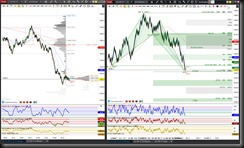
GC_F testing Alt Bat PRZ at 1236.5, due to expansion, the implication is a stall or bounce into resist. Initial lvls to brk & hold are above 1242.7 or below 1235.8. Upside brk increases proability of retrce mode w/ ideal min tgt at 1260.1. Dnside brk has ideal tgt 1208.8 w/ scaling pts at green/gray lvls.
Have a question about an instrument not listed? Just ask me.
Trading involves substantial risk and is not suitable for all investors. Past performance is not indicative of future results.

