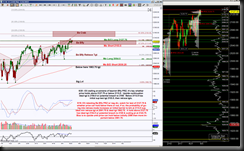
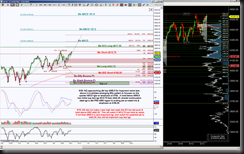
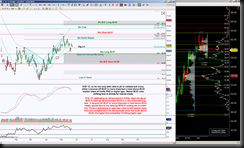
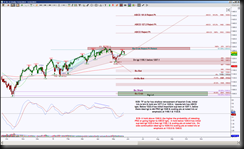
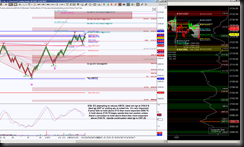
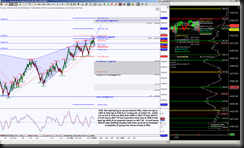
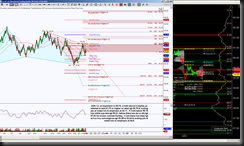
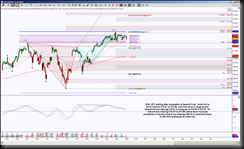
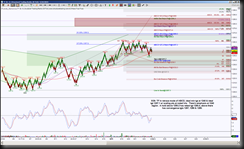
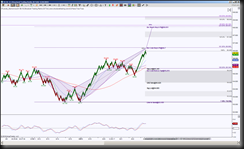
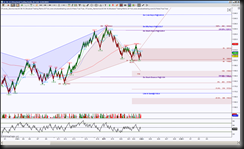
Intraday charts added.
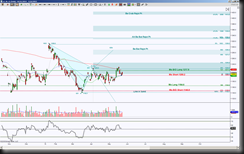
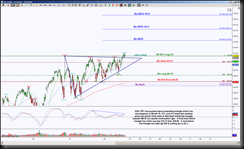
Please refer to these charts for the week, these are the bigger harmonic scenarios & these levels are to be referred to when an intraday scenario is exceeded.
Intraday Charts:
Reminder: I have begun to create short videos for members for each item in my Terminology Page. You need to be an active member and logged into Structural Trading to have access to them. It is a work in progress so please be patient for me to complete the whole list. You can access it two ways, use this link: https://structuraltrading.com/help/terminology-videos/ OR when you go to https://structuraltrading.com/ just hover your mouse of the “Help” tab and you’ll see listed Terminology Videos, the titles that are colored in blue have a video. This will be updated as time permits.
Make sure when you click on the title, that you scroll down to the bottom to choose which recording to watch because you may have choices, example: http://screencast.com/t/T9xIbIIqCG
I have a personal commitment for the month of March. This is a conflict with the time I do premarket analysis every morning. So I’m changing things up a bit. I am doing detailed commentary for what to watch for at the beginning of the week. I will be doing the charts in the evening for the next day, these will be larger harmonic rotations but the Swordlines and Pivots are updated daily, these are to be considered very important intraday support and resistance levels and should be treated as such, in route to harmonic levels. If there’s really no change from a harmonic perspective, I will not alter the analysis I’m starting with but you’ll receive email notification of any adjustments in levels. If you have any questions please don’t hesitate to email me.
GC, SPY & TF analysis was posted here Remember to update the levels for changes.
A video on using STLevels Indicator: http://www.screencast.com/t/W1ORACTVY

