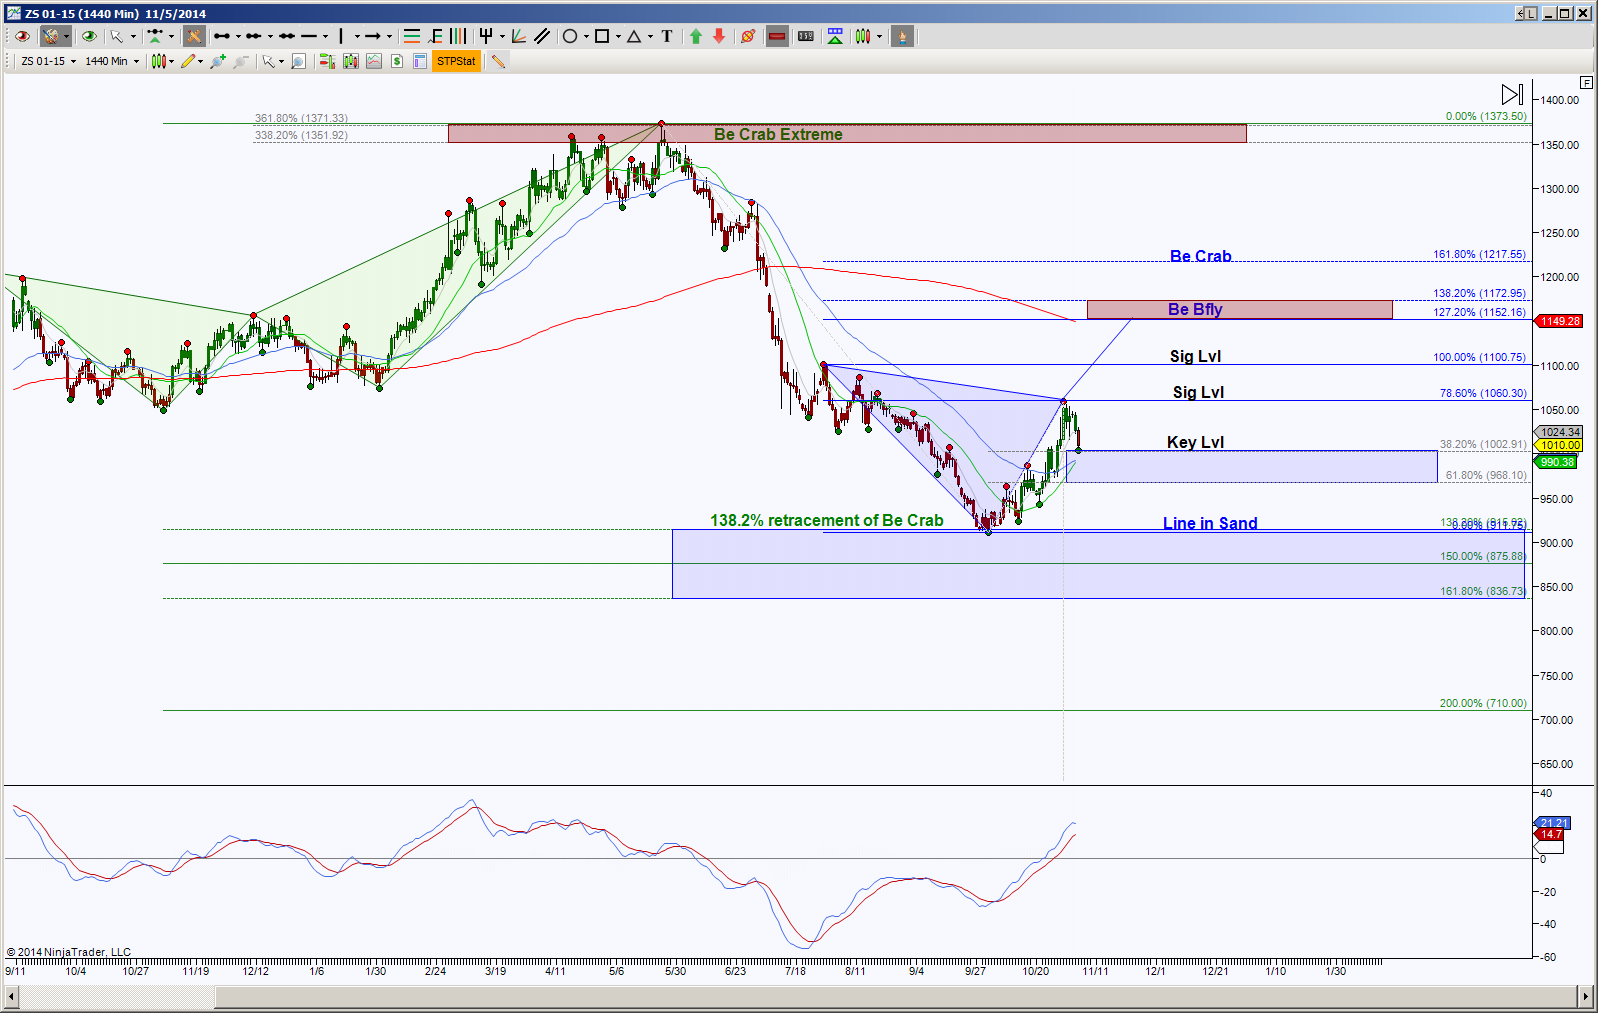
Soy Beans Day chart shows a bearish harmonic pattern, called a Bearish Crab, retraced 138.2%, that’s a wowza retracement, because like I’ve mentioned before, harmonic patterns dream of retracing 100%, this one was a dream come true, then some. This 138.2% is a GRZ, (Golden Ratio Zone) which gave us a heads up for a potential stall or bounce. With this bounce into 1060.25 region, a new harmonic rotation has emerged and is currently forming a necessary leg that remains valid as long as 911.75 is not breached. Note there’s a smaller GRZ that price has pulled back to at 1003, so this offers a clue of bias, a hold above it implies a retest of 1060.25, a hold below it implies an attempt to test the bottom of the GRZ and if price can breakdown the GRZ, increases the probability of retesting 911.75. Two rejection points have been at the GRZ, thereby proving my interest in knowing where GRZ levels are.
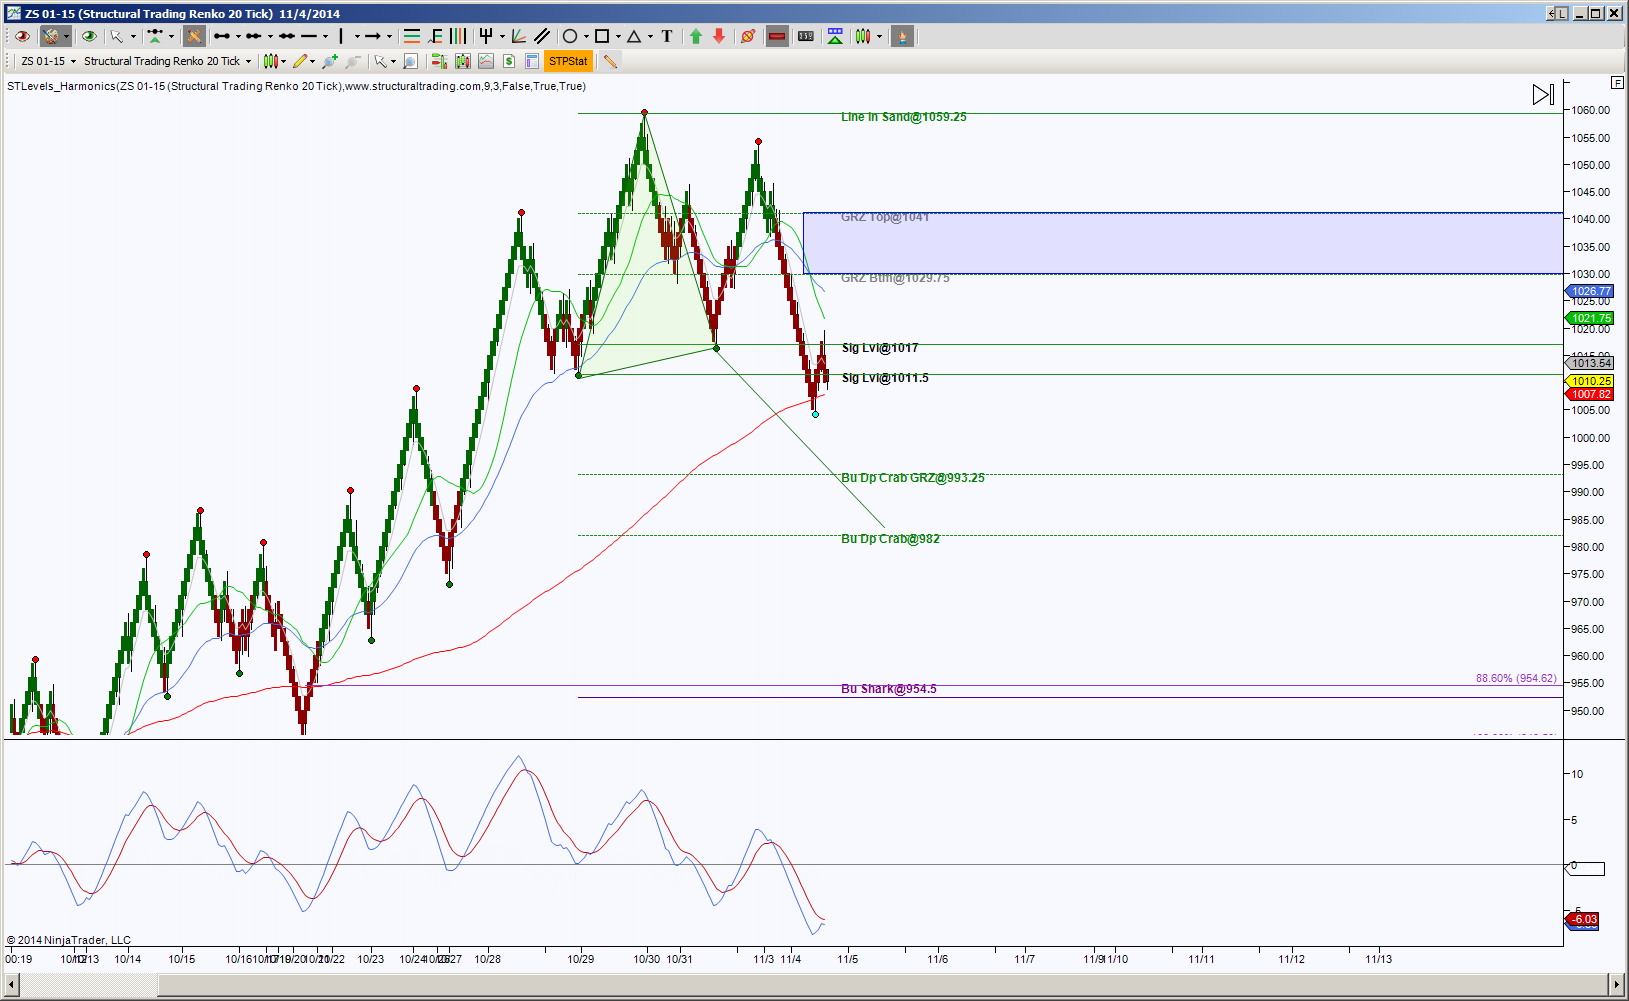
An intraday chart, in this case, an STRenko 20 bar, shows that while the day price bars are pulling back into support, this smaller view shows price is stalling at a couple of key components. One, a significant level of 1011.5, the other, a rising 200 sma as support at around 1107.75. So these are the initial levels to break and hold, a hold above 1011.5 has a nearby resistance target at 1017, and above there increases the probability of retesting the GRZ on this chart. Ahem, another GRZ, gotta love these zones!
Currently this chart shows downside bias, and I wouldn’t consider a shift in that bias unless price can hold above first 1017 and more important above 1029.75. A hold below 1011.5 still has the 200 sma to contend with, so I’d like to see a hold below for a higher probability of completing one or both emerging harmonic patterns. The first one is a Bullish Deep Crab, colored green, the ideal target is 982 but for me, I consider the 993.25 an important factor, because it is a GRZ level.
At this juncture we don’t know if these targets of 993.25 and 982 are going to be reversal points or merely scaling points in route to a lower harmonic PRZ target of 954.62. Understanding price action at these levels can offer clues. Notice if price completes this Crab at 982, this helps the price in the Day chart test approximately the middle of the GRZ.


