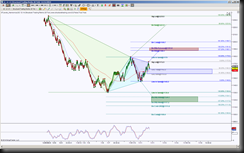
 For an intraday perspective for Gold futures, I’m using an STRenko 20 bar. This chart shows that price is in between opposing emerging harmonic patterns with the line in the sand levels at 1130.4, 1145.5 and 1179. Upon breaching one of these levels will invalidate the opposing pattern or patterns.
The current initial levels to break and hold are 1172.5 or 1162.2. Price has pulled back into the 1162.2 support, this has confluence in that it is a bullish cross validation as well as a GRZ.
A break down of 1162.2 creates a downside bias with the primary targets at 1155.8, 1145.5 and 1130.4. Downside continuation has the ideal target at 1100.4 with scaling points at the cyan fibs with noted harmonic pattern labelled targets. Keep in mind that although the ideal target is 1100.4, each one of those particular targets along the way has an opportunity to be a strong rejection point.
Since the 1145.5 low, the bias has been toward the upside, this current pullback into 1162.2 is like the last chance Charlie to validate a moving average bullish cross. So if price can hold above this 1162.2 region, then the bullish cross remains valid and the initial upside target is 1172.5 then the line in the sand level 1179.
Above 1179 has the ideal target of 1223.5 for the largest of the three harmonic patterns trying to form on this chart. One of the great things about harmonic patterns is smaller patterns get the incentive going to play out the larger ones. So the pattern colored blue has completion targets of 1188.1, 1191.8 and 1199.7, this will help price push above the important 1179 level to increase the probability of reaching 1223.5. With each upside target taken out enforces the probability.
