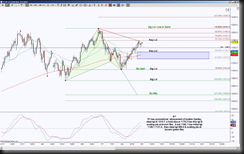
THEN, dated September 1, 2014, using the September contract for the Russell 2000 futures, I was watching for either retracement targets of a bullish Gartley harmonic pattern at 1187.7, 1198.4 and 1210.7 with a hold above 1179.2 OR the targets of 1149.1, 1131.5 and ideal target of 989.5 with a break down of 1160.1.
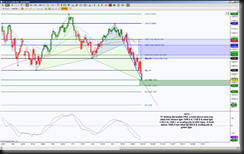
NOW, over a month later, dated for October 13, 2014, shows price is testing the initial portion of the Bullish Butterfly completion zone aka PRZ (potential reversal zone). Although the prices are different due to the contract change, the harmonic patterns remain the same.
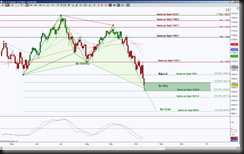
This chart shows the December contract and how the harmonic pattern levels are in relation to the targets based off the September contract. Note each level noted is 4.6 point difference.
So as we can see with the correlation chart, once price brokedown the September price 1160.1 (December price of 1155.5), price has reached the target of 1103.1 September (December 1098.5) and is currently testing the Butterfly PRZ. This will be an important zone. A hold below 1051.6 implies a test of the lower portion of the zone at 1032.2 and there’s a potential breach to test 1017.2.
Whether price holds now above 1051.6 or after testing 1032.2 or even 1017.2, once price does hold above 1051.6, the probability increases to go into retracement mode, meaning upside move into the targets noted on the 10/13 chart. Otherwise a hold below 1017.2 has 984.9 target.


